Key Takeaways
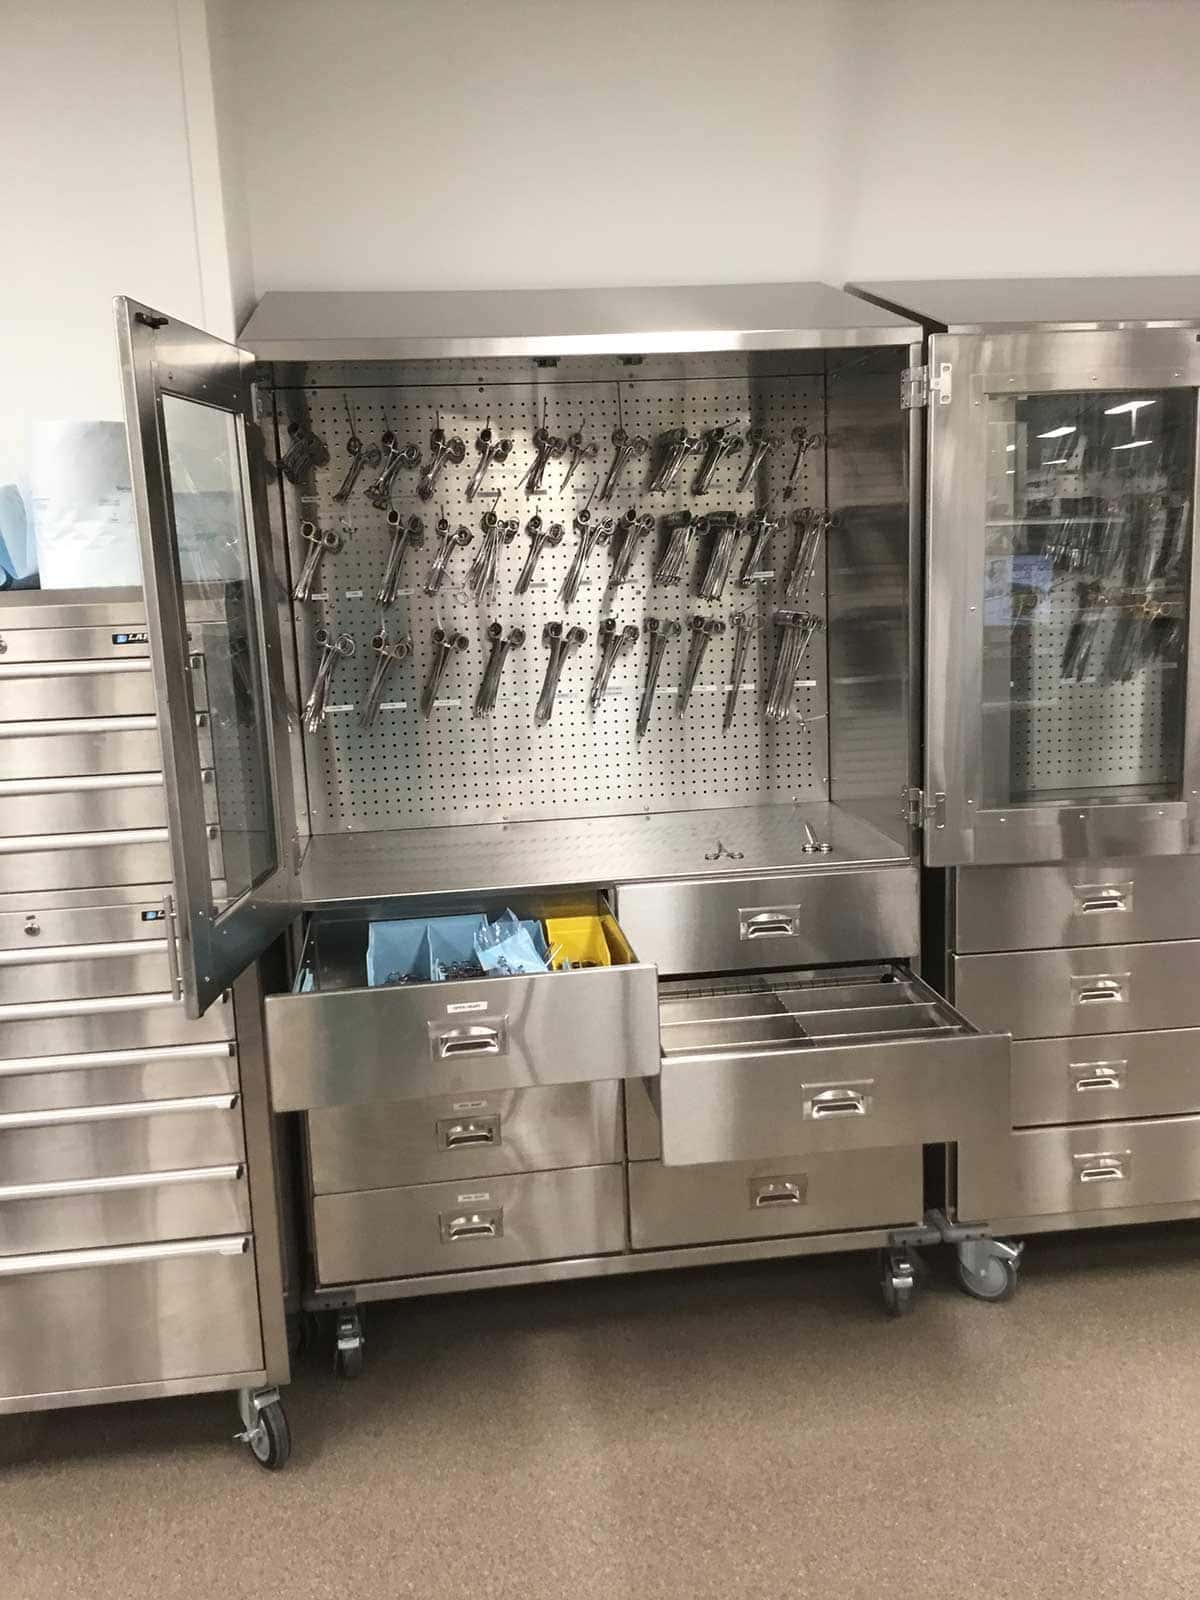
A nurse spends 15 minutes searching for IV tubing while a septic patient waits. A trauma team discovers the chest tube tray is empty mid-resuscitation. The pharmacy gets another emergency call for a medication that should have been restocked yesterday.
These scenarios play out daily in emergency departments across the country. They share a common root cause: emergency department par levels set by intuition rather than data.
Par level management, determining how much inventory to keep on hand, directly impacts patient safety, clinical workflow, and operational costs. Yet most EDs still rely on tribal knowledge, staff preferences, and reactive adjustments after stockouts occur. The result: critical items run out while excess inventory expires on shelves.
The data tells a compelling story. Healthcare facilities implementing data driven par level optimization achieve a 31.8% reduction in stockout events and a 42.3% decrease in emergency orders. One hospital eliminated 2 hours 39 minutes of nursing time per shift previously spent on supply logistics. A major health system projected $80 million in cost savings over five years through supply chain transformation.
These aren't marginal improvements. They represent a fundamental shift from reactive inventory management to predictive, optimized operations.
This guide provides ED leaders with a practical framework for implementing data-driven par level optimization. We cover foundational concepts, analytical methods, technology enablers, and change management strategies. Whether you're addressing chronic stockouts, reducing expired inventory, or freeing nursing time for patient care, the path forward starts with treating par levels as a data problem, not a guessing game.
Sustained improvement requires ongoing performance tracking. KPIs must capture both availability and efficiency. Regular monitoring identifies drift before it becomes a crisis.
| KPI | Definition | Target Threshold |
| Critical item stockout rate | Percentage of critical items experiencing zero inventory | <1% for life-saving items |
| Time-to-restock | Hours from stockout identification to restoration | <4 hours critical; <24 hours routine |
| Fill rate | Percentage of requests fulfilled from on-hand stock | >98% critical; >95% overall |
| Emergency order frequency | Rush/stat orders per week | <5 per week; declining trend |
| Metric | Definition | Interpretation |
| Inventory turnover | Annual usage value ÷ average inventory value | Higher = more efficient; target 8-12x |
| Value of expired items | Dollar amount discarded due to expiration | Target <0.5% of inventory value |
| Working capital in inventory | Total dollar value of ED supplies on hand | Declining while maintaining availability = success |
Even well-intentioned optimization fails when teams ignore data quality, impose rigid standardization, or treat par levels as permanent. Awareness of failure modes enables teams to build safeguards. Following par level best practices helps avoid these common mistakes.
Optimization benefits erode within 12-18 months without active governance.
No single strategy fits all EDs. Urban trauma centers face different challenges than critical access hospitals. Effective inventory optimization techniques must be tailored to the local context.
A 45-bed urban ED analyzed 18 months of ADC data for its top 50 medications. The team applied 99% service level targets for life-saving medications and 95% for routine items. Analysis revealed ondansetron held 14 days of supply while epinephrine, far more critical, held only 3 days.
Results after recalculation:
A community hospital piloted optimization in its 8-bed acute care pod for 12 weeks, implementing weight-based bins and adjusted ADC settings for 75 items. Effective medical supply storage combined with data-driven par levels produced rapid results. Initial nursing resistance subsided after week 3 when staff observed improved availability.
Pilot results:
A six-hospital system implemented centralized governance with site-level autonomy. Tier 1 items (life-saving) required system-approved par levels. Tier 2 items allowed local adjustment within ±20%. Tier 3 items (routine) permitted full local discretion within budget.
Enabling practices:
Most EDs see initial results within 8-12 weeks. Quick wins, addressing obviously misaligned critical item par levels, show improvement within 2-3 weeks. Full optimization across all ED medical supply inventory typically requires 6-12 months. Sustainable results require ongoing governance; benefits erode within 12-18 months without active maintenance.
Hybrid governance works best. Supply chain owns data and methodology. The pharmacy leads medication decisions. Nursing provides workflow input and feedback. The ED medical director approves clinical priorities. Establish a committee meeting quarterly with clear decision rights for each stakeholder.
ED optimization should integrate with enterprise initiatives: consumption data feeds hospital-wide demand forecasts, formulary rationalization supports volume contracts, surge stock requirements inform emergency preparedness, and inventory reductions free working capital for other investments. Healthcare inventory analytics from the ED can inform system-wide supply chain improvements.
Data-driven par level optimization transforms ED supply management from reactive firefighting into proactive operations. Research shows facilities implementing these strategies achieve 30-40% reductions in stockouts, 15-20% decreases in inventory costs, and dramatic improvements in staff satisfaction and patient care time.
Healthcare supply chain complexity often exceeds internal capacity. External partners bring specialized expertise and proven methodologies that accelerate implementation.
Ready to transform your ED's supply chain performance? Contact DSI to explore how data-driven par level optimization can improve patient safety, reduce costs, and free your clinical staff to focus on patient care.
With 21 years of sales management, marketing, P&L responsibility, business development, national account, and channel management responsibilities under his belt, Ian has established himself as a high achiever across multiple business functions. Ian was part of a small team who started a new business unit for Stanley Black & Decker in Asia from Y10’ to Y14’. He lived in Shanghai, China for two years, then continued to commercialize and scale the business throughout the Asia Pacific and Middle East regions for another two years (4 years of International experience). Ian played college football at the University of Colorado from 96’ to 00’. His core skills sets include; drive, strong work ethic, team player, a builder mentality with high energy, motivator with the passion, purpose, and a track record to prove it.