Key Takeaways
Robotic surgery programs manage hundreds of high-value instruments with finite use lives, platform-specific compatibility, and reprocessing protocols that standard instrument tracking wasn't built for. When storage systems and usage data live in silos, the result is predictable: missing instruments, blown cycle limits, duplicate purchases, and case delays.
This guide covers how to achieve robotic storage integration by connecting physical storage with usage analytics into one end-to-end workflow, what to track, how to identify instruments, how to design storage that produces trustworthy data, which efficiency metrics prove the investment, and how to implement without disrupting active schedules.
End-to-end instrument tracking records location, status, and ownership at every transition, from receipt through retirement. The goal: a single real-time record showing where an instrument is, its condition, and how many cycles remain.
Scope definitions:
| Lifecycle Stage | Where | Who | Event Recorded | Why It Matters |
| Receive | Loading dock | Materials staff | Serial capture, lot entry | Establishes chain of custody |
| Store | Sterile storage | SPD tech | Bin location, sterility expiration | Enables real-time locating |
| Pick / Issue | Storage → OR | Surgical tech / circulator | Pull time, case ID, room ID | Starts case-level cost tracking |
| Use | Surgical field | Surgeon | Procedure type, use-count increment | Drives utilization analytics and cycle compliance |
| Return → Reprocess | OR → decon → sterilizer | Transport / SPD | Condition flag, wash cycle, sterilizer ID, BI results | Validates IFU compliance |
| Release | Sterile storage | SPD tech | Shelf location, expiration date | Closes the loop; available again |
| Repair / Quarantine / Retire | Biomed / vendor / disposal | Biomed / quality | Fault code, reason, final cycle count | Manages exceptions and removes from active pool |
Facilities lose $100,000–$500,000 per year to instrument losses, delays, and duplicate purchasing from disconnected views. A data‑driven inventory approach closes these gaps by linking storage events to procedure-level data.
| Visibility Gap | Operational Impact | Metric Affected |
| Unknown location | 10–20 min/case searching; late starts | Time-to-locate, turnover time |
| Unknown sterility status | Emergency reprocessing triggered | Fill rate, turnaround time |
| Cycle-count uncertainty | Instruments exceed use limits undetected | Cycle compliance, patient safety |
| No utilization data | Capital tied up in excess stock | Utilization rate, carrying cost |
| No storage-to-case linkage | Duplicate purchases; traceability gaps | Over-purchasing rate, audit readiness |
Top efficiency outcomes: Fewer case delays, faster turnover, lower shrinkage, better cycle compliance, and reduced over-purchasing.
| Dimension | Standard | Robotic | Tracking Implication |
| Unit cost | $50–$500 | $700–$3,200+ | Per-unit tracking cost-justified |
| Cycle limits | Hundreds; no cap | 10–20 per IFU | Must count and enforce automatically |
| Repair frequency | Low | High (articulating joints, cables) | Instrument-level repair history required |
| Handling | Standard reprocessing | 4× magnification; platform-specific protocols | IFU compliance captured per event |
| Compatibility | Universal | Platform- and generation-specific | Must pair instrument to robot serial number |
Lifecycle risks: Cycle-limit overruns, premature wear, missed refurbishment windows, incompatible pairing, and higher downtime cost ($2,000+/min when a $2M system sits idle).
Each event must answer: what instrument, where it moved, what status it entered, and who recorded it. Without this schema, downstream analytics collapse.
| Event | Required Fields | Optional Fields |
| Receive | Instrument ID, timestamp, location, status, actor, PO/RMA | Vendor, lot, cost |
| Store / Release | Instrument ID, timestamp, bin/shelf, status, actor | Sterility expiration, tray/set ID |
| Pick / Issue | Instrument ID, timestamp, location (from/to), status, actor | Case ID, surgeon ID |
| Open / Use | Instrument ID, timestamp, OR room, use-count increment | Procedure type, duration, condition flags |
| Return | Instrument ID, timestamp, location, status (dirty), actor | Condition notes, damage flags |
| Decon / Sterilize | Instrument ID, timestamp, station/sterilizer ID, actor | Cycle parameters, BI result, IFU flag |
| Repair / Quarantine / Retire | Instrument ID, timestamp, location, status, actor | Fault code, reason, RMA, final cycle count |
Non-negotiable fields: Unique instrument identifier, location granularity (room/shelf/bin), closed status taxonomy, system-generated timestamp, and defined source-of-truth rule.
Most mature programs use a hybrid, 2D barcodes for permanent ID, RFID for ambient location sensing.
| Method | Pros | Cons | Best Fit | Key Failure Mode |
| 2D barcode (laser-etched) | Permanent, zero recurring cost, GS1-compliant | Line-of-sight required; manual scan each hand-off | Traceability and lifecycle tracking | Etch degrades after repeated sterilization |
| RFID (passive) | Bulk reads; no line-of-sight; automated capture | $0.50–$3/tag; metal interference; autoclave survival varies | Room/cabinet-level location tracking | Tag delamination after steam cycles |
| Computer vision | No tag required; detects type and condition | High compute cost; accuracy drops in cluttered trays | Tray assembly verification | Misidentification of similar instruments |
| Hybrid (barcode + RFID) | Definitive ID + ambient location | Two systems to maintain; higher upfront cost | High-volume programs needing both | Reconciliation complexity |
Label durability checklist: Validate sterilization tolerance at full parameters, set minimum readability thresholds, place marks away from mechanical wear surfaces, schedule periodic QA reads, and define a relabel workflow that preserves lifecycle history.
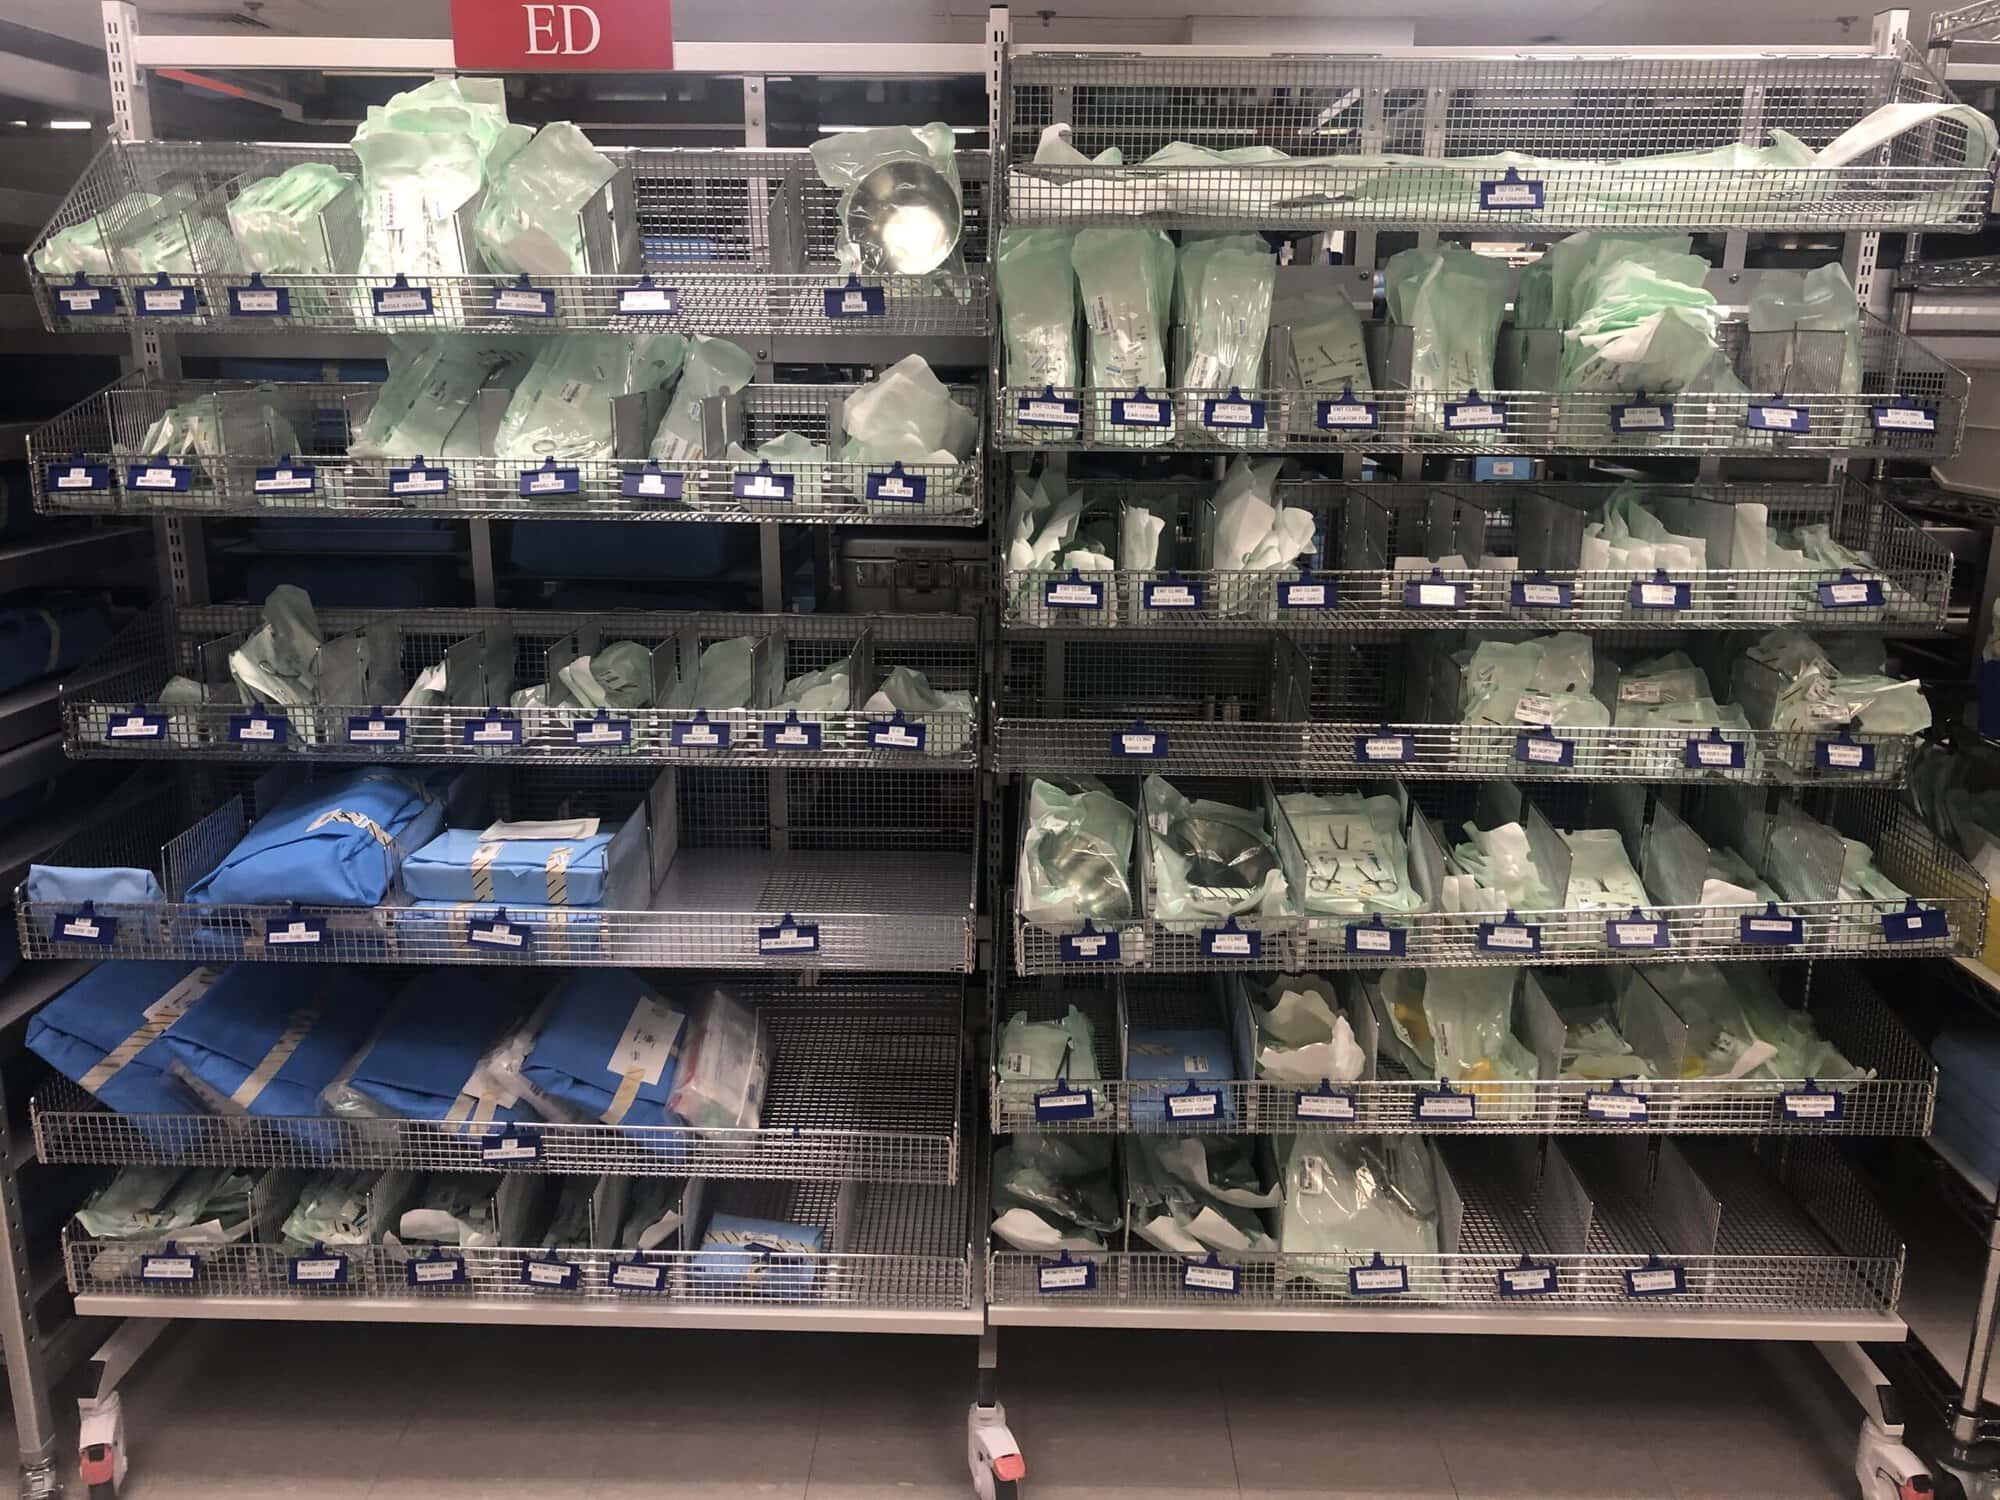
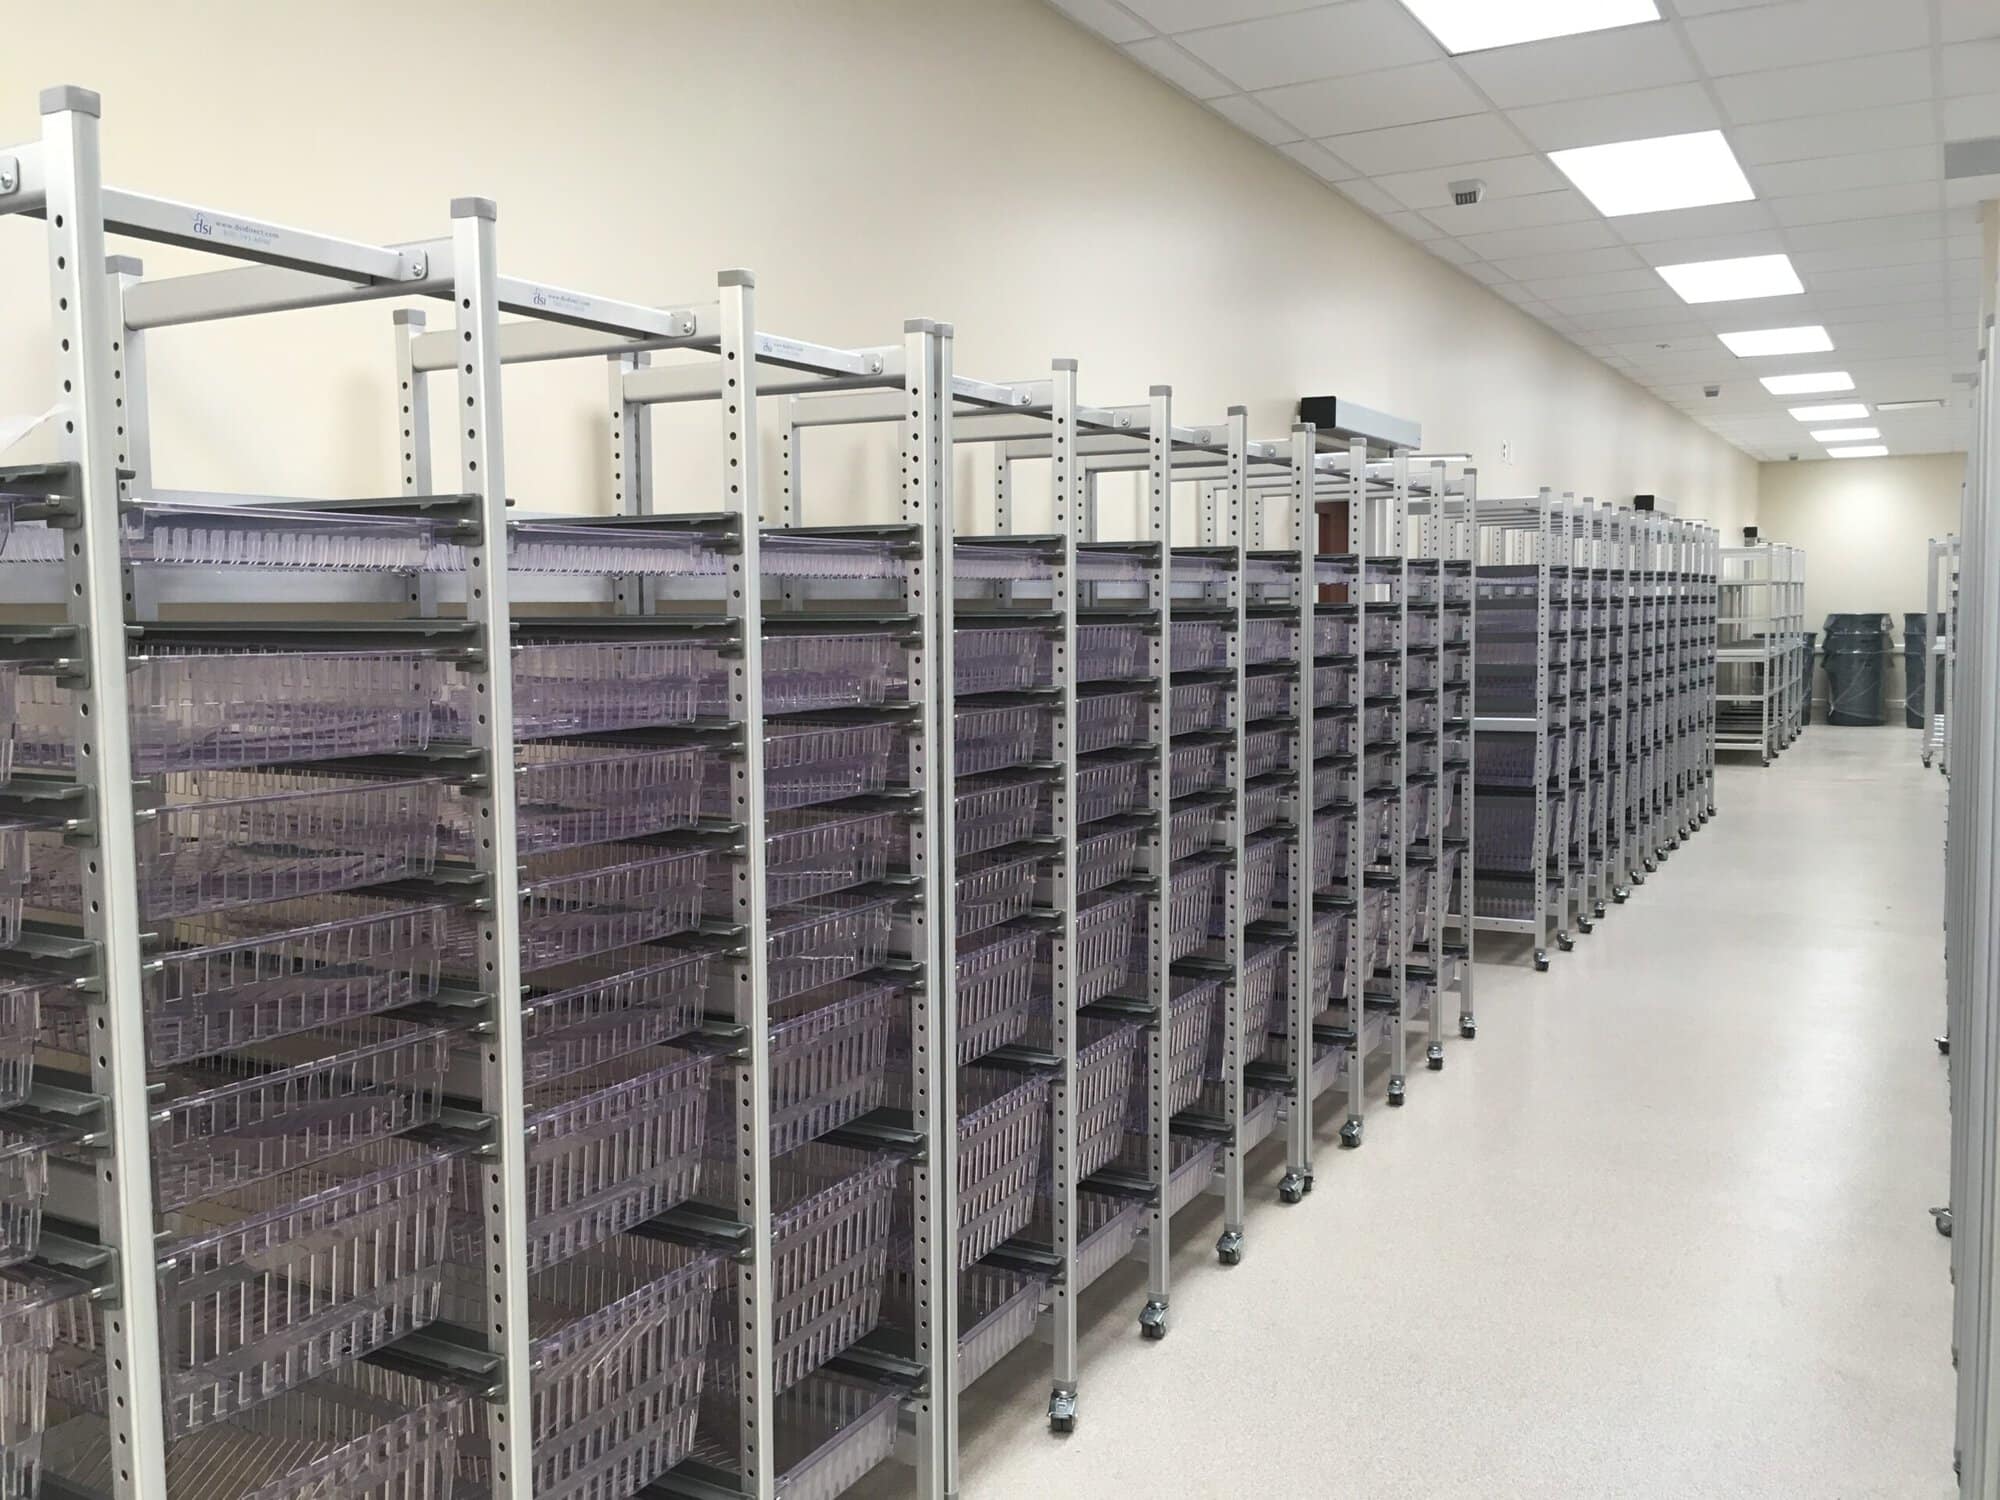
The best storage configurations force capture by design, locked access, integrated readers, or mandatory scan-to-release gates.
| Pattern | Auto-Captured | Risk | Best Use Case |
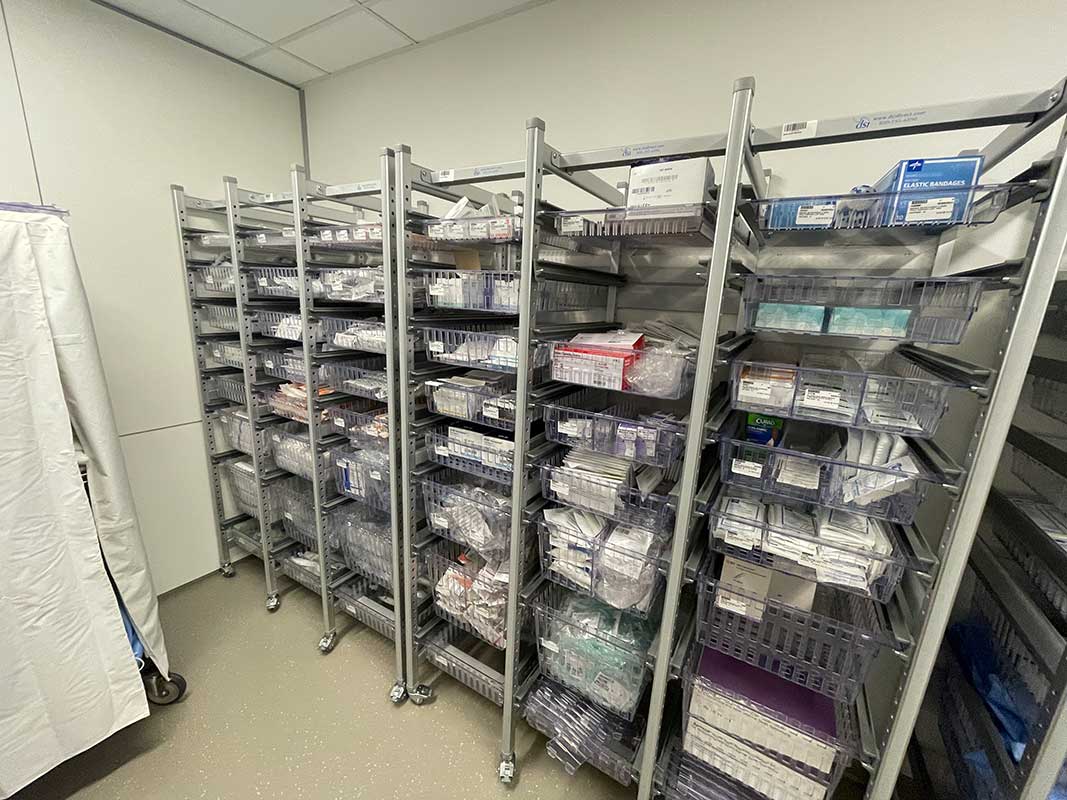
| Central sterile (open shelving + scan stations) | Check-in/out via manual scan | Staff skip scans under pressure | Budget-constrained; barcode-only start |
| Smart cabinets (RFID, locked) | Presence/absence sensed continuously | Cabinet offline = blind spot | High-value robotic instruments |
| Mobile carts (scan-gated) | Contents scanned at pack and delivery | Items added/removed in transit without re-scan | Case-cart workflows; long transport distances |
| Room-based (OR sub-sterile) | Depends on room infrastructure | High bypass risk in emergencies | Dedicated robotic ORs |
For robotic instrument storage layouts, see the Wide Robotic Instrument Storage guide (PDF).
Exception handling: Items moved without a capture trigger "last known location" alerts at the next reconciliation point. Cabinet outages fall back to handheld scan with automatic sync on reconnect. Emergency pulls use badge + reason code overrides with mandatory post-case reconciliation. Returns without verification are flagged at the next cabinet or cycle event.
| Category | Metric | Formula / Definition | Target | Data Sources |
| Availability | Fill rate | (Cases with all instruments at start ÷ total cases) × 100 | ↑ | Schedule, pick/issue events |
| Availability | Stockout frequency | Cases with ≥1 unavailable instrument | ↓ | Pick events, delay logs |
| Throughput | Sterile turnaround | Soiled return → sterile release | ↓ | Return, sterilize, release timestamps |
| Utilization | Utilization rate | (Cases used ÷ cases available) × 100; flag <20% | ↑ | Use events, availability records |
| Utilization | Idle ratio | Zero uses in 90 days ÷ total active | ↓ | Use events, instrument master |
| Quality | Cycle compliance | Retired/refurbed before exceeding max ÷ total at threshold | ↑ 100% | Use-count ledger, refurb events |
| Cost | Cost per case | (Depreciation + reprocessing + repair + loss) ÷ cases | ↓ | Financial system, use/repair events |
| Cost | Loss/shrink rate | Lost ÷ total active, annualized | ↓ | Retirement events, instrument master |
Daily ops needs: Stockouts, readiness for tomorrow, turnaround bottlenecks, missing item alerts. Leadership needs: Utilization trends, cost per case, pool sizing, loss rate breakdowns.
| Conflict Type | Resolution Rule | Audit Artifact |
| Two locations simultaneously | Most recent timestamp wins; if <30 sec apart, higher-confidence source wins | Both events, resolution source, flag |
| Missing usage event | If returned soiled, infer use; back-fill with "inferred" flag; send confirmation task | Inferred record, linked events |
| Duplicate scans | First accepted; duplicates within 10 sec suppressed | Accepted + suppressed events |
| Orphaned reprocessing | Create synthetic return event; flag "not captured" | Synthetic event, linked reprocessing |
| Cycle limit exceeded post-hoc | Quarantine immediately; flag all cases since breach | Quarantine event, affected case list |
| Option | Latency | When to Choose | Pitfall |
| Warehouse-first | Batch (minutes–hours) | Single-site, <500 cases/month, analytics-focused | Stale data; no real-time alerts |
| Event-stream-first | Real-time (seconds) | Multi-site, high-volume, instant cycle-limit alerts needed | Over-engineering for small programs |
| Hybrid | Real-time ops + batch analytics | Need both "where is it now" and "how did we perform" | Dual systems drift if schemas diverge |
Inputs: Storage events, SPD events, OR/procedure signals, maintenance records. Outputs: Dashboards, alerts, replenishment tasks, maintenance triggers.
Applying effective inventory control strategies starts with this governance layer.
| Role | Can View | Can Edit | Audit Requirement |
| SPD tech | Location, status, cycle counts | Reprocessing events | Every write + overrides with reason |
| OR staff | Availability, case assignments | Issue, use, return events | Every scan + emergency overrides |
| Materials mgmt | Par status, cost data | Receive, store, reorder events | Par changes with justification |
| Biomed | Repair history, fault trends | Repair, quarantine, retire events | Every state change with authorization |
| Leadership | All dashboards, KPIs | None (read-only) | Access and export events logged |
Audit trail checklist: Immutable event log, who/what/when/where on every record, exception decisions preserved, reconciliation history with full lineage.
| Phase | Deliverable | Acceptance Criteria | Timeline |
| 1. Map journey | Documented current-state workflow | All stakeholders sign off | 2–3 weeks |
| 2. Pilot IDs | 50–100 instruments labeled; validated through reprocessing | ≥98% scan success after 10 cycles | 3–4 weeks |
| 3. Storage capture | Scan stations or smart cabinets live | ≥95% auto-capture rate | 4–6 weeks |
| 4. Usage capture | OR-side capture linked to case IDs | ≥90% instruments have matching use event | 4–6 weeks |
| 5. Unify timeline | Single instrument timeline; reconciliation active | <5% unresolved gaps | 3–4 weeks |
| 6. Dashboards | Live KPIs for ops and leadership | Top 3 questions answered per audience | 2–3 weeks |
| 7. Automation | Alerts, replenishment triggers, maintenance scheduling | <2% false-positive rate over 30 days | 4–6 weeks |
| 8. Scale | All platforms, SKUs, service lines | Same criteria as pilot phases | 8–16 weeks |
Pilot success checklist: ≥98% scan rate, <5% exception rate, ≥95% location accuracy, ±1 cycle-count accuracy, ≥90% staff adoption, measurable time savings.
| Failure Mode | Root Cause | Detection Signal | Prevention |
| Manual bypass | Time pressure; no enforcement | Gap rate rises | Locked storage; scan-to-release gates |
| Label/tag loss | Sterilization wear; poor attachment | Rising scan failures | Lifecycle-tested attachment; periodic QA |
| False availability | Return logged without placement | Not found at pick | Physical confirmation (weight/shelf sensor) |
| Mismatched sources | No source-of-truth rule | Conflict alerts spike | One authoritative source per event type |
| Drifting taxonomy | Free-text fields; training gaps | Unexpected status values | Closed picklists; governance approval for changes |
Design principles: Capture at the point of work, minimize steps, enforce required events as physical gates, and make exceptions easier to log through the system than around it.
Understanding how supply chain optimization through storage supports this framework helps teams select the right infrastructure for each scenario.
| Scenario | Required Events | Ownership / Billing | Exception Approver |
| Loaner sets | Receive (loaner flag + vendor ID), issue, use, return-to-vendor | Vendor-owned; billed per use | Materials mgmt + vendor coordinator |
| Vendor consignment | Standard lifecycle + periodic audit events | Vendor-owned until consumed | Materials mgmt; purchasing for conversion |
| Cross-site transfers | Transfer-out, transit, transfer-in | Cost center transfer; both sites update | OR director or materials mgr at both sites |
| Urgent intra-case swaps | Return original (swap reason), issue + use replacement; both linked to case | Both charged to case | Circulator authorizes; surgeon confirms |
| Damage post-case | Return (damage flag), quarantine, repair or retire | Biomed budget; vendor RMA if under warranty | Biomed + SPD manager |
| Recall / quarantine | Quarantine (recall ID, hold authority); release requires clearance | Manufacturer cost if recall-driven | Quality/risk mgmt; biomed for assessment |
State machine; primary loop: Available → Issued → In Use → Returned (Dirty) → In Reprocessing → Available. Gated branches: Repair, Quarantine, and Retired require authorization to enter and exit. Lockout rules block direct transitions back to Available without passing the authorization gate.
| Requirement | Question to Ask | Red Flag |
| ID method support | Both barcode and RFID supported? | Proprietary tags only; no hybrid path |
| Integrations | Live integrations with your EMR/SPD stack? | All integrations "custom"; no API docs |
| Analytics depth | Instrument-level drill-down and custom reports? | Canned reports only; no export |
| Auditability | Immutable event log with actor attribution? | Events can be edited or deleted |
| Offline mode | Events queued and synced after outage? | System stops capturing during outage |
| Exportability | Open-format export (CSV, JSON, FHIR)? Data ownership clause? | Proprietary formats; export fees |
Build vs. buy: Building gives integration control and customization but requires dedicated resources and self-managed compliance. Buying gives speed, support, and validated workflows, but limits customization and risks data lock-in.
Either way: insist on open data formats, documented APIs, and contractual data ownership.
Yes. 2D laser-etched barcodes provide reliable instrument-level ID at near-zero per-unit cost. RFID adds ambient location sensing but is an enhancement, not a prerequisite. Many programs start barcode-only.
For robotic instruments with manufacturer-enforced cycle limits, instrument-level tracking is necessary. Tray-level alone can't manage use counts, predict refurbishment, or support serial-level recall response.
Room-level accuracy eliminates most search time. Shelf/bin-level is the next gain. Sub-room precision has diminishing returns unless loss prevention justifies it.
Increment a counter on every use event. Alert at 80% of the manufacturer's max. Block issue at the limit. Log refurbishments as lifecycle events that reset the counter.
Map your instrument journey. Laser-etch barcodes on 50 high-use instruments. Deploy handheld scanners at the storage exit and OR entry. Use pilot data to scope the full system.
Programs that connect storage visibility with usage analytics stop reacting to missing instruments and start managing a controlled asset pipeline, with fewer delays, lower replacement costs, tighter cycle compliance, and data that supports purchasing and staffing decisions.
Next steps: Choose tracking level → define event schema → pilot identification → capture at storage → link usage → build KPIs → automate triggers.
Ready to move from research to action? Contact DSI to schedule a workflow mapping workshop or run a pilot readiness assessment for your robotic surgery program.
With 21 years of sales management, marketing, P&L responsibility, business development, national account, and channel management responsibilities under his belt, Ian has established himself as a high achiever across multiple business functions. Ian was part of a small team who started a new business unit for Stanley Black & Decker in Asia from Y10’ to Y14’. He lived in Shanghai, China for two years, then continued to commercialize and scale the business throughout the Asia Pacific and Middle East regions for another two years (4 years of International experience). Ian played college football at the University of Colorado from 96’ to 00’. His core skills sets include; drive, strong work ethic, team player, a builder mentality with high energy, motivator with the passion, purpose, and a track record to prove it.