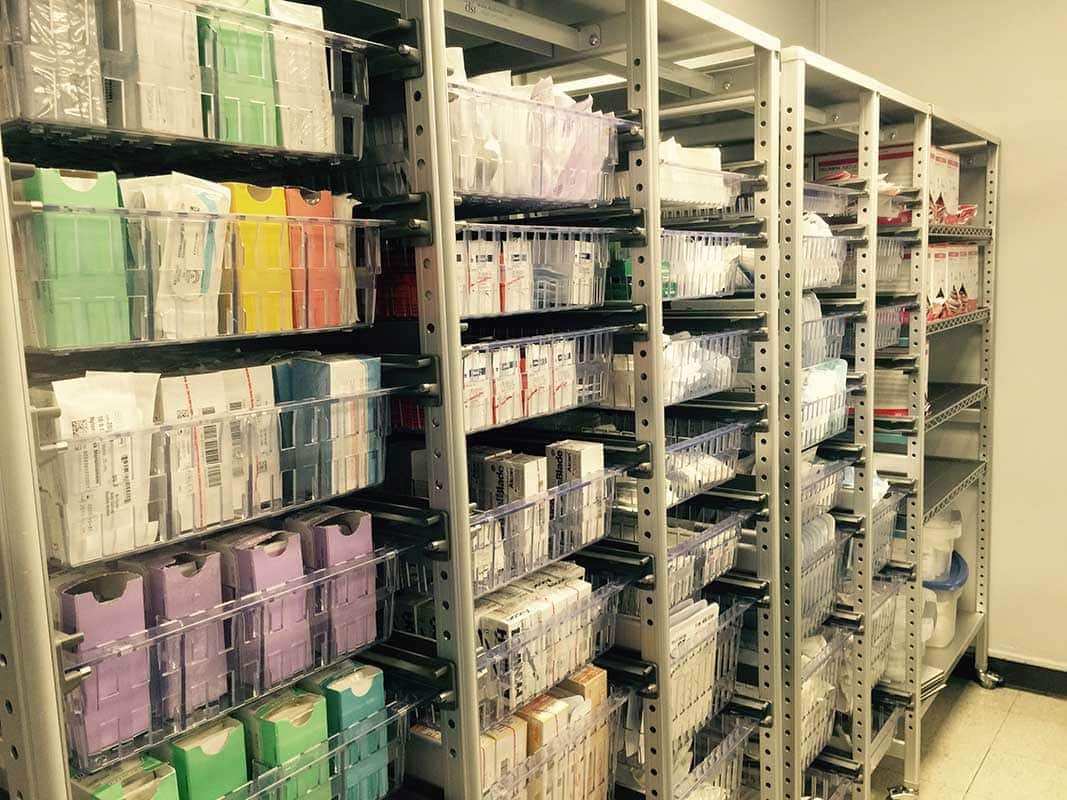
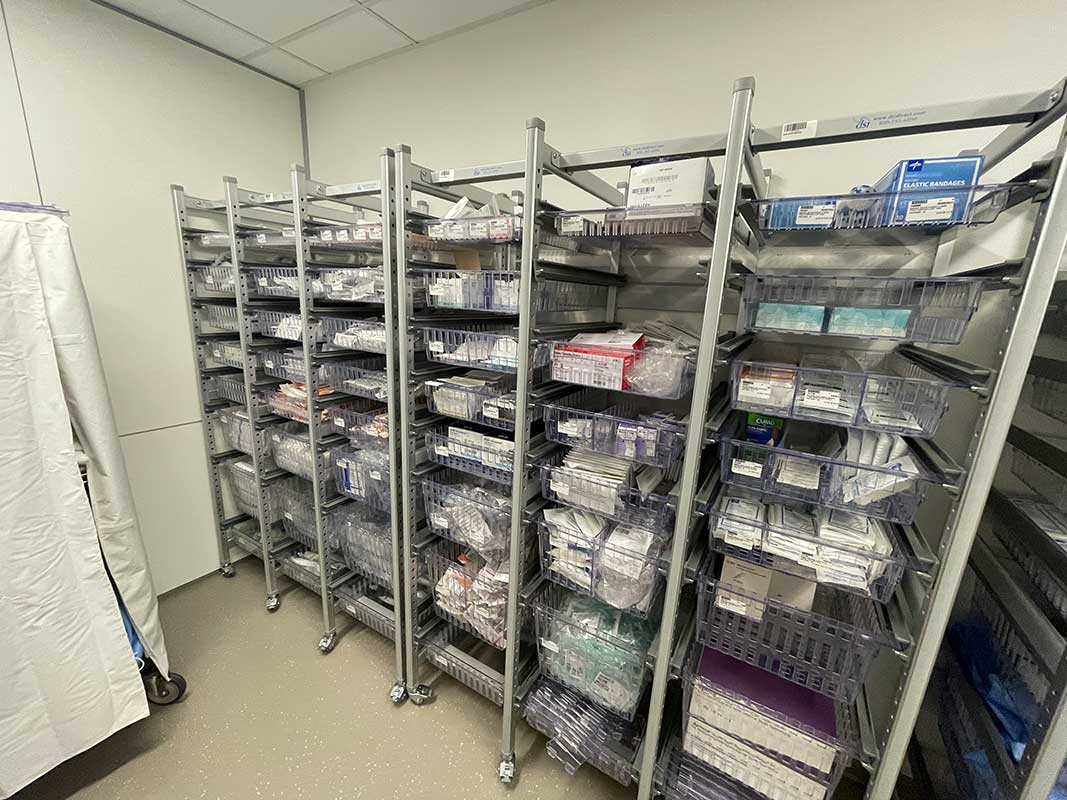
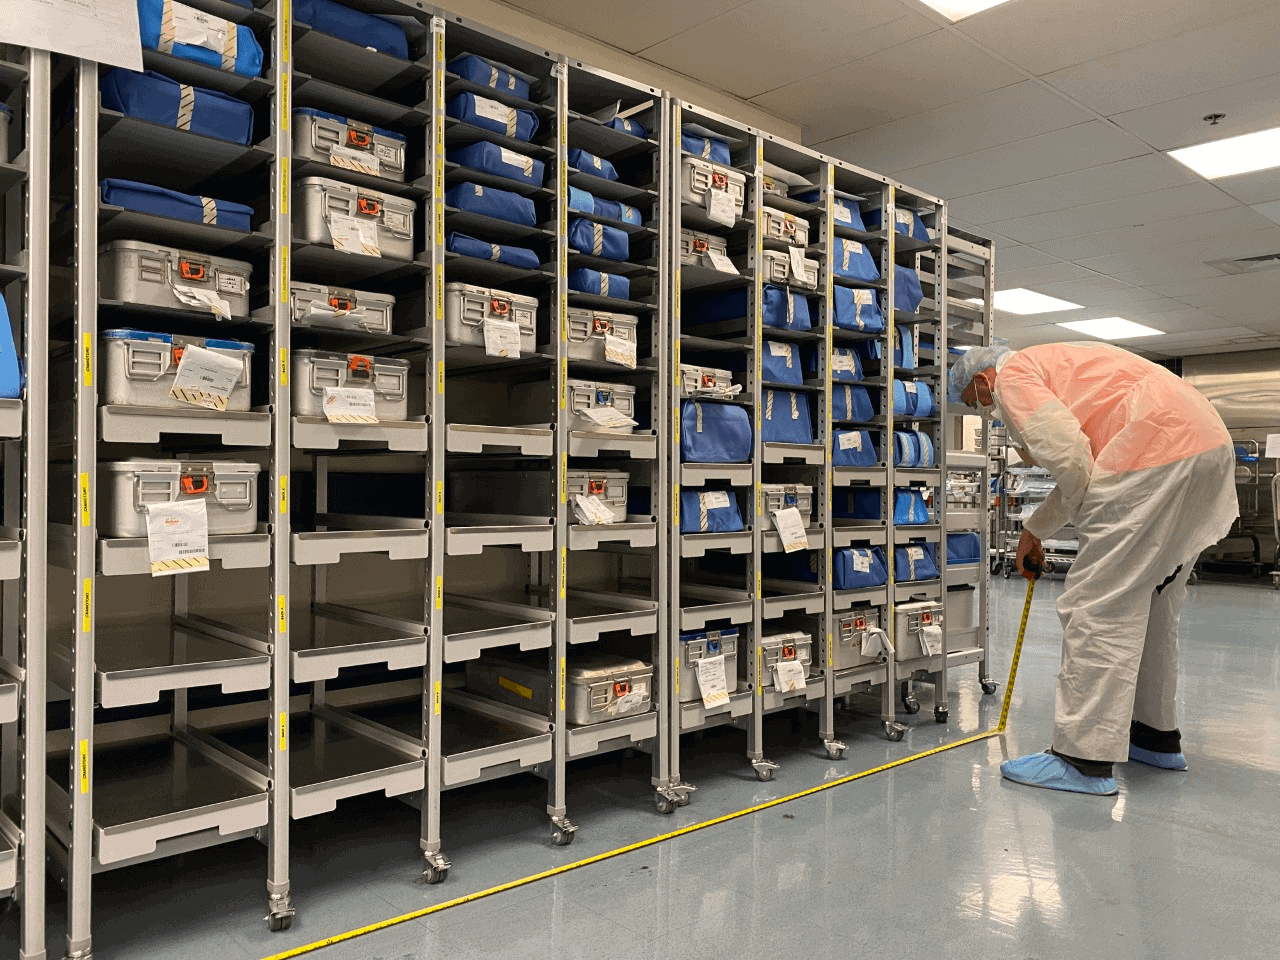
Medical supplies consume 15 to 30 percent of hospital operating expenses, making materials management best practices essential for financial health. Mid-sized hospitals routinely carry $20 to $40 million in preventable supply-chain waste that never appears as a budget line item. Facilities that adopt evidence-based healthcare supply optimization strategies report 15 to 50 percent reductions across inventory value, holding costs, and clinical time lost to supply hunting.
The gap between reactive manual management and sustained data-driven operations determines financial performance and patient safety outcomes. Proven practices include demand-driven replenishment, usage-based par levels, automated inventory tracking, cross-department standardization, and disciplined change management. These 2026 trends reflect a maturation from broad SKU consolidation to targeted refinement using continuous consumption data and embedded accountability frameworks.
Effective inventory management balances supply availability against carrying costs without causing stockouts or tying up excessive working capital. Medical supplies are the second-largest controllable cost in a hospital after labor. Facilities carry 20 to 30 percent of annual supply spend as inventory, and annual carrying costs equal 20 to 30 percent of that inventory value.
Each SKU represents a distinct product identifier tracked through the supply chain. Optimal management requires visibility into consumption patterns, accurate par levels, and replenishment triggered by actual usage. Without this visibility, staff orders defensively, creating buffer stock that drives preventable waste.
Demand-driven replenishment triggers orders based on actual consumption rather than fixed schedules or arbitrary counts. KANBAN systems use visual signals to eliminate guesswork that forces buffer inventory. A 2-bin KANBAN holds each item in two containers at the point of use, with the empty bin serving as the reorder signal while staff draws from the second.
Par levels define the quantity of each supply item to keep on hand. Reset par levels against real consumption data rather than staff estimation. Recalculating par levels from usage data instead of carrying forward historical assumptions eliminates overstocking and releases working capital within a single replenishment cycle.
Standardization reduces variation, shrinks training burden, eliminates duplicate SKUs, and unlocks volume pricing across departments. Hospitals could safely cut supply expense by an average of 17.7 percent through reducing variation, according to Navigant research. This equates to roughly $11 million per hospital per year in addressable savings.
Formulary standardization in ostomy care produces 40 percent or more lower average costs. Rush University Medical Center achieved a 21 percent spend reduction and saved $800,000 in under a year through single-category shoulder replacement standardization. Organizations do not know how much variation exists until they measure it.
LEAN inventory management and 2-bin KANBAN replenishment deliver the most evidenced return in healthcare supply optimization. Inventory holding cost reductions averaged approximately 35 percent from 2-bin KANBAN implementation, according to HFMA survey data. A three-year quality improvement study documented weekly consumable cost reductions of 40 to 50 percent.
Out-stocking rates fell to near zero in the same study. Before KANBAN implementation, stockouts occurred 20 to 30 times per 1,000 patient days. After rollout, weekly storeroom costs dropped from roughly $8,500 to $4,300, and staff compliance with the system rose from 76 to 95 percent.
Par-level optimization driven by usage data is the fastest, lowest-risk reduction in carrying cost available to most facilities. Between 20 and 40 percent of SKUs are overstocked relative to actual usage, based on BlueBin health-system engagements. Typical hospital supply overstock ranges from 20 to 50 percent across categories.
Typical US hospital inventory turns run 8 to 12 per year, while AHRMM benchmark ranges sit at 3 to 5 turns. Ten turns equals 36 days-on-hand, while 20 turns equals 18 days-on-hand. Usage-based par discipline releases working capital and requires no new hardware when paired with lean inventory practices.
Automated perpetual inventory tracking moves data from periodic snapshots to continuous awareness. Barcode inventory accuracy reaches 85 to 90 percent, while RFID accuracy approaches 99 percent. RFID adopters saw an 82 percent improvement in inventory tracking capability.
Approximately 68 percent of large hospitals in North America and Europe are transitioning to automation in storage and tracking systems as of 2026. Inventory cost reductions from automated systems range from 18 to 30 percent. However, adoption succeeds 62 percent more often when a dedicated ownership role exists, linking technology success directly to governance.
The table below compares the three common inventory tracking methods used in acute care facilities, based on the accuracy and adoption benchmarks discussed above.
| Tracking Method | Inventory Accuracy | Typical Use Case | Implementation Notes |
| Manual / Periodic Count | Lowest, prone to drift | Legacy systems, low-turnover storage | No technology investment; highest labor cost and audit risk |
| Barcode Scanning | 85-90% | High-volume, lower-cost consumables | Lower upfront cost; depends on staff scan compliance |
| RFID Tagging | Approximately 99% | Sterile instruments, implants, high-value assets | Higher upfront cost; adoption succeeds 62% more often with a dedicated ownership role |
Vendor consolidation increases purchase volume with primary partners, drives contract compliance, and reduces administrative friction from managing hundreds of contracts. Seventy-four percent of hospital purchasing leaders report working closer with distributors than two years prior. Seventy-six percent cite supplier reliability as a top value driver, while 78 percent prioritize cost efficiency.
Estimated annual waste tied to supply-chain fragmentation reaches approximately $25 billion industry-wide. However, single-source vendor models concentrate supply risk in one relationship. After pandemic-era shortages, reliability overtook price as the top value driver because consolidation without reliability assessment creates a single point of failure.
Space auditing paired with high-density storage systems recovers 40 to 50 percent of floor area by eliminating fixed aisles. High-density mobile shelving and vertical track systems save 25 to 50 percent of storage space. SPD capacity can increase up to 50 percent from track shelving in the same footprint.
Cutting inventory 20 to 30 percent through par optimization reclaims 1,000 to 3,000 square feet per facility. New healthcare construction costs $400 to $730 per square foot, making space reclamation far more cost-effective than building new. Annual operating cost of hospital space runs $50 to $100 per square foot.
Value Analysis Committees bring clinical staff, supply chain, and finance into one decision process. VAC composition includes clinicians and nursing to judge clinical fit, supply chain to review contracts, finance to confirm cost alignment, and a value analysis lead to coordinate reviews. Effective committees track financial impact, operational improvement, and patient outcomes after approval rather than stopping at purchase decisions.
Many VACs run on spreadsheets, email, and manual notes, which slows decisions and raises compliance risk. Most committees stop at purchase approval instead of tracking real-world performance. Cross-functional discipline prevents product decisions made in isolation by department, preserving standardization and consolidation gains.
Fear-based ordering without usage visibility drives buffer stock creation because the consequence of running out feels worse than the cost of holding too much. Buffer stock is expensive and largely invisible on financial reports. Mid-sized hospitals routinely carry $20 to $40 million in preventable supply-chain waste.
Facilities carry 20 to 30 percent of annual supply spend as inventory. Annual carrying cost equals 20 to 30 percent of inventory value. Optimizing par levels to actual consumption frees $3.75 million to $6.25 million in working capital at mid-sized facilities.
Skipped or inaccurate audits let expired and obsolete stock accumulate unnoticed until discarded. Industry-average expiration rates on medical supplies run 8 to 10 percent. Expiration on some medical-surgical and pharmacy categories reaches 10 to 30 percent.
Before KANBAN implementation, 10 to 20 percent of consumables were discarded due to expiration. A facility spending $100 million annually loses $8 to $10 million to expiration. Approximately 50 percent of hospitals cannot proactively identify and manage expired supplies, and 20 percent of hospital leaders lose more than $10,000 monthly in obsolete or expired inventory.
Siloed departmental purchasing creates duplicate SKUs for similar products, forfeits volume discounts, and obscures total spend. Purchased services represent 20 percent or more of total system spend. Fragmentation forces higher per-unit prices and drives overstocking and expiration simultaneously.
Supply-chain waste never shows up as a line item in a budget. Inventory record inaccuracy drives both overstock and daily shortages in the same facility at the same time. Organizations do not realize the extent of variation until they measure it systematically across departments.
Aggregate US nurse supply-hunting costs reach approximately $14 billion per year. At a 300-bed hospital with 800 nursing FTEs, supply hunting costs roughly $12 million annually. Nurses spend up to 60 minutes per shift hunting supplies instead of delivering patient care.
Sixty-nine percent of perioperative staff have delayed a case while tracking down supplies. Supply hunting never appears as a supply line item, making this one of the largest hidden drains in materials management. A two to three percent turnover rise costs $1 to $2 million per year at a 300-bed hospital when supply availability ranks among top-10 nurse dissatisfaction drivers.
Cramped SPD storage raises the risk of instrument damage and contamination. Poor storage infrastructure can threaten accreditation and trigger penalties. SPD refers to the Sterile Processing Department, where reprocessing protocols demand organized, compliant storage.
Annual operating cost of hospital space runs $50 to $100 per square foot. Before planning expansion, facilities should evaluate high-density retrofit options versus new construction. Inadequate layout compounds supply-hunting costs and expiration losses by forcing workarounds that slow retrieval and hide aging stock.
Total Cost of Ownership evaluation examines costs over a five- to ten-year horizon, including implementation support, service, reliability, and workflow fit. Lowest-cost vendor selection ignores total cost factors that dominate over extended periods. The cheapest vendor is often the least reliable.
Total Cost of Ownership evaluation should include implementation support, ongoing service, reliability, and workflow fit over five to ten years. After pandemic-era disruptions, reliability cited by 76 percent of purchasing leaders overtook price as the top supplier value driver. Effective committees weigh implementation timelines, training plans, system compatibility, and support alongside initial price.
Most hospital LEAN programs stall by year three as attention shifts to newer priorities. Organizations sustaining results invest 15 to 20 percent of total transformation budget in capability development. Effective sustainability requires leadership commitment, staff engagement, structured capability transfer, and continuous-improvement mechanisms.
Retrofitting sustainability onto a stalled program is far harder than building it in at the start. When staff perceives a program purely as cost-cutting, engagement fades, and the initiative is abandoned. Small deviations accumulate without embedded feedback loops, erasing efficiency gains over time.
Value Analysis Committees provide the governance layer that keeps standardization and consolidation from unraveling. Technology adoption succeeds 62 percent more often when a dedicated ownership role exists. Technology without ownership stalls within months of implementation.
Effective VACs track outcomes after approval rather than stopping at purchase decisions. Committees that run on spreadsheets and email slow decisions and raise compliance risk. Cross-functional collaboration prevents product decisions made in isolation and preserves supply-chain discipline across departments.
Most hospital LEAN initiatives stall by year three as competing priorities emerge. Small deviations accumulate when a sustainability framework is absent. After consultants depart, most organizations see improvement decline without structured capability transfer.
Without embedded feedback loops and accountability, efficiency gains erode over time. Five S applied as a standalone tool rarely delivers durable savings because housekeeping methods do not replace replenishment systems. Sustained programs build continuous-improvement mechanisms into operations from day one, not as an afterthought.
Seventy-four percent of respondents report care quality affected in surgery and anesthetics from supply shortages. Sixty-four percent report emergency care affected by shortages. Sixty percent experienced shortages of more than 20 drugs, supplies, or devices within six months.
Shortages caused surgical cases to be rescheduled, postponed, or canceled. Thirty-five percent of respondents resorted to gray-market purchasing due to shortages. These disruptions represent preventable harm when organized workstation storage and par-level discipline eliminate stockouts.
Supply shortages cause preventable patient harm through delayed treatment and forced use of alternative products. Workarounds hospitals adopt can themselves increase the likelihood of harm. Fifty-two percent report pain management affected, 45 percent cardiology, and 44 percent hematology-oncology.
Supply availability ranks among the top-10 nurse dissatisfaction drivers. When efficient medical cart configurations and standardized bin systems ensure immediate access, clinical staff spend less time hunting and more time delivering care. Materials management discipline protects patients, not just margins.
Facilities closing the materials management gap report 15 to 50 percent reductions across inventory value, holding costs, and clinical time lost. Up to 50 percent of clinician time is returned to patient care from documented hospital deployments. Systems report 14,000 or more clinical hours returned annually through optimized supply access.
Working capital freed by optimizing par levels ranges from $3.75 to $6.25 million at mid-sized facilities. Average carrying-cost decreases reach approximately 24 percent from automated systems. These gains translate directly into improved surgical scheduling, reduced case delays, and eliminated preventable harm from supply shortages.
The financial and clinical stakes in materials management demand integrated, evidence-based strategies that address root causes rather than symptoms. Demand-driven replenishment through LEAN and 2-bin KANBAN systems eliminates the guesswork that forces buffer inventory. Usage-based par-level optimization releases millions in working capital within a single cycle. Automated perpetual inventory tracking achieves 99 percent accuracy with RFID when ownership and accountability are in place.
Standardization across departments cuts variation, consolidates SKUs, and unlocks volume pricing while reducing training burden. Vendor consolidation reduces administrative friction and captures discounts, provided reliability assessment prevents single-point-of-failure concentration. Space audits paired with high-density retrofits reclaim 1,000 to 3,000 square feet without the $400 to $730 per square foot cost of new construction. Cross-functional Value Analysis Committees enforce governance that keeps gains from unraveling, and continuous-improvement frameworks sustain results beyond year three when most LEAN programs stall.
Integrating these practices eliminates the $20 to $40 million in preventable waste mid-sized hospitals carry while cutting stockouts to near zero and returning up to 50 percent of clinician time to patient care. The most successful 2026 implementations begin with process-first LEAN and usage data, layer in automation with dedicated ownership, and build sustainability into operations from the start. Distribution Systems International partners with acute care facilities to design and implement space-efficient storage systems that support demand-driven workflows and long-term operational discipline.
These figures, drawn from the research cited throughout this guide, summarize the ranges facilities can use to gauge their own performance.
| Metric | Benchmark Range |
| Hospital inventory turns (typical US facility) | 8 to 12 per year (AHRMM benchmark: 3 to 5) |
| Holding cost reduction from 2-bin KANBAN | Approximately 35% |
| SKUs overstocked relative to actual usage | 20% to 40% |
| Barcode inventory tracking accuracy | 85% to 90% |
| RFID inventory tracking accuracy | Approximately 99% |
| Medical supply expiration rate, industry average | 8% to 10% |
| Supply expense reduction from standardization | Approximately 17.7% (Navigant research) |
| Floor space recovered from high-density storage retrofit | 40% to 50% |
Distribution Systems International has partnered with acute care facilities since 1990 to design LEAN inventory systems, 2-bin KANBAN replenishment, and high-density storage that cut carrying costs and eliminate stockouts. Our team starts with a complimentary on-site analysis, delivers CAD-based layouts and ROI projections, and manages full turnkey implementation from delivery through inventory transfer. Call Distribution Systems International at (800) 393-6090 or request a price quote to schedule a storage assessment for your facility.
Healthcare materials management best practices govern how a facility plans, stores, and replenishes medical and surgical supplies from receipt through point of use. The discipline covers demand forecasting, par-level setting, inventory tracking, storage design, and vendor coordination across departments such as the SPD, OR, and Materials Management. Because medical supplies represent the second-largest controllable hospital cost after labor, effective materials management directly shapes both operating margin and clinical readiness. Facilities that formalize these processes typically see measurable reductions in carrying costs, stockouts, and supply-hunting time.
A 2-bin KANBAN system replaces manual reordering with a visual signal, cutting inventory holding costs by an average of approximately 35 percent according to HFMA survey data. Facilities that pair the system with usage-based par levels have documented weekly consumable cost reductions of 40 to 50 percent within a three-year window. Stockout rates, which often run 20 to 30 incidents per 1,000 patient days before implementation, tend to fall close to zero once the two-bin signal is in place. Savings vary by facility size, SKU mix, and staff compliance, so most organizations pilot the system in a single department before a full rollout.
Typical US hospital inventory turns run 8 to 12 times per year, above the AHRMM benchmark range of 3 to 5 turns, meaning many facilities already outperform the older standard. Ten turns roughly equals 36 days of supply on hand, while 20 turns equals about 18 days on hand, so a higher turn rate generally signals tighter inventory control. The right target depends on lead times, item criticality, and storage capacity, since pushing turns too high on critical supplies raises stockout risk. Usage-based par-level review is the most direct way to move turns in the right direction without new hardware.
RFID inventory tracking reaches approximately 99 percent accuracy compared with 85 to 90 percent for barcode systems, and adopters report an 82 percent improvement in tracking capability. The technology suits high-value, high-turnover categories such as sterile instruments and implants, where miscounts carry compliance and patient-safety consequences. Adoption succeeds about 62 percent more often when a facility assigns a dedicated ownership role rather than treating the rollout as a one-time IT project. Facilities with lower transaction volume or tighter budgets can still gain much of the accuracy benefit from disciplined barcode workflows paired with usage-based par levels.
A Value Analysis Committee, or VAC, brings clinical staff, supply chain, and finance together to evaluate new products and standardization decisions before they reach the floor. Clinicians assess clinical fit and safety, supply chain reviews contract and consolidation impact, and finance confirms the cost case, so no single department makes the call alone. Effective committees track financial impact, operational improvement, and patient outcomes after approval instead of stopping the review at the purchase decision. Facilities that run VAC decisions through spreadsheets and email tend to see slower approvals and weaker compliance than those with a structured tracking process.
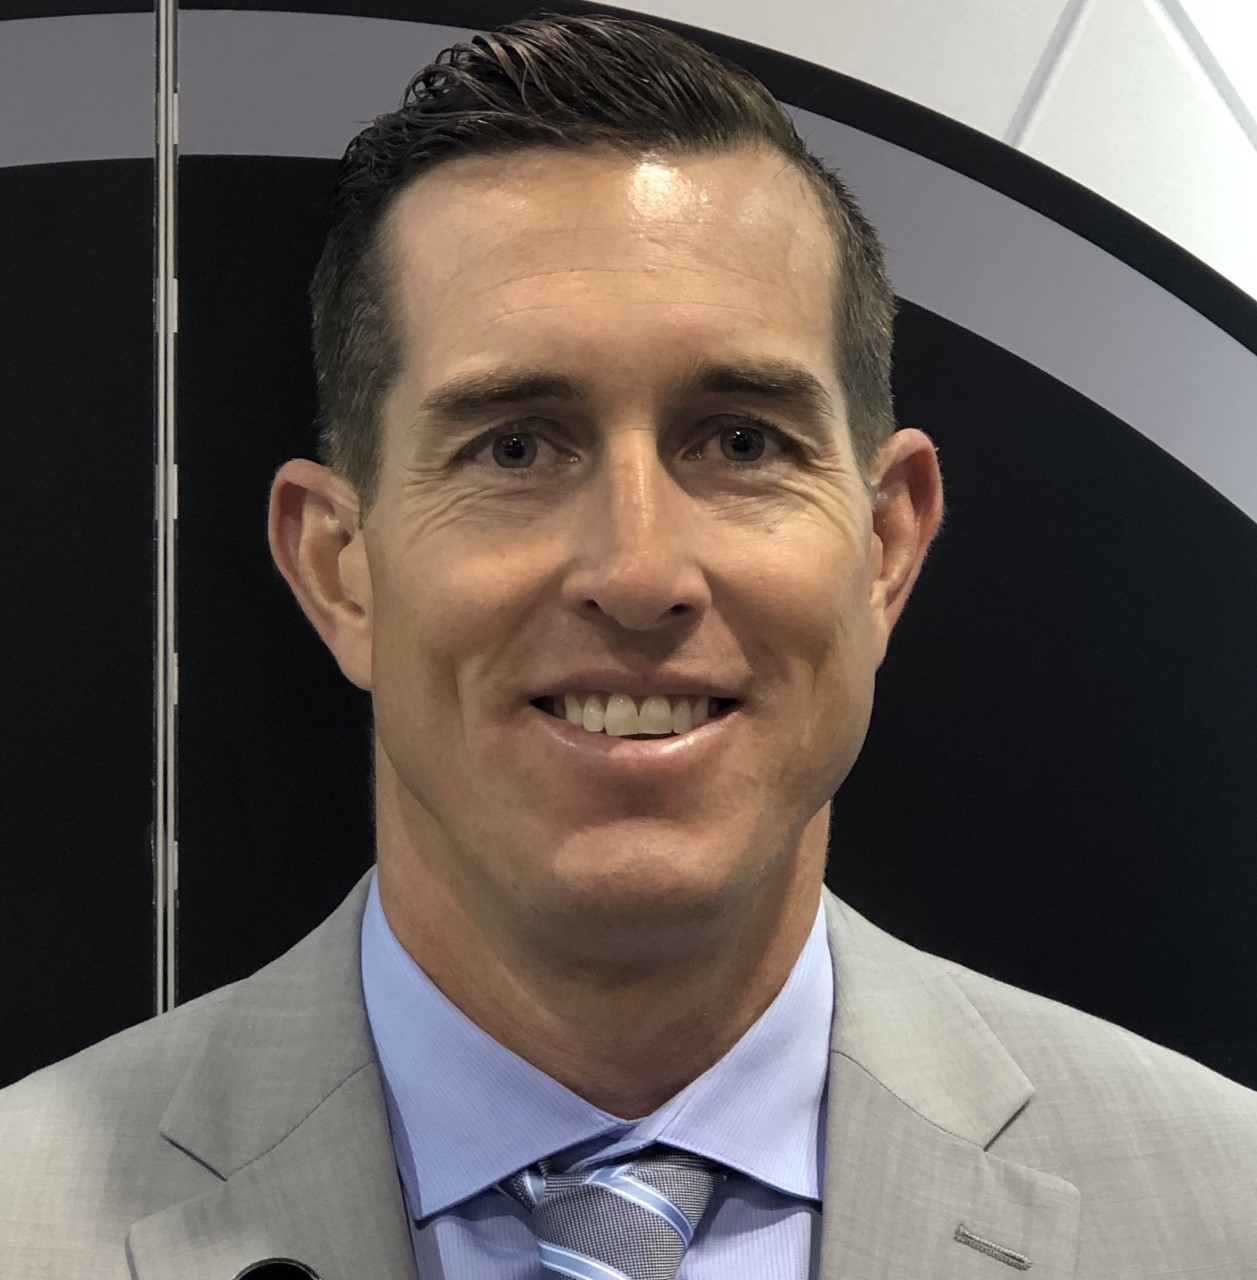
With 21 years of sales management, marketing, P&L responsibility, business development, national account, and channel management responsibilities under his belt, Ian has established himself as a high achiever across multiple business functions. Ian was part of a small team who started a new business unit for Stanley Black & Decker in Asia from Y10’ to Y14’. He lived in Shanghai, China for two years, then continued to commercialize and scale the business throughout the Asia Pacific and Middle East regions for another two years (4 years of International experience). Ian played college football at the University of Colorado from 96’ to 00’. His core skills sets include; drive, strong work ethic, team player, a builder mentality with high energy, motivator with the passion, purpose, and a track record to prove it.