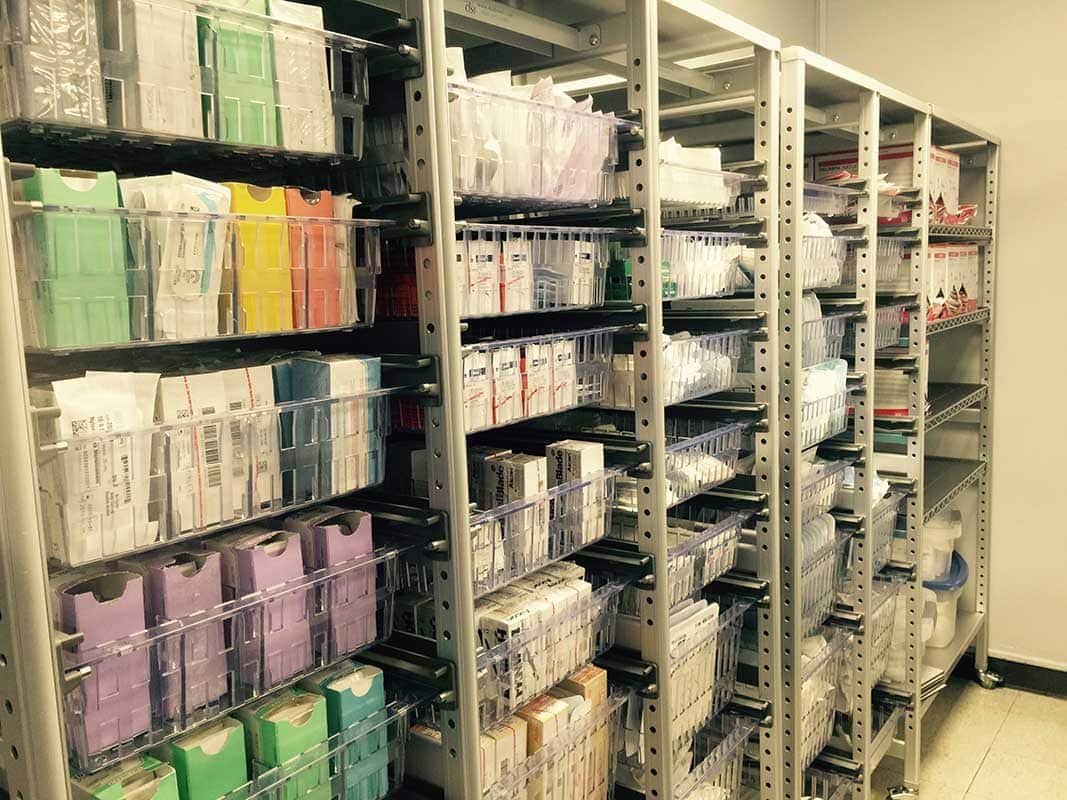
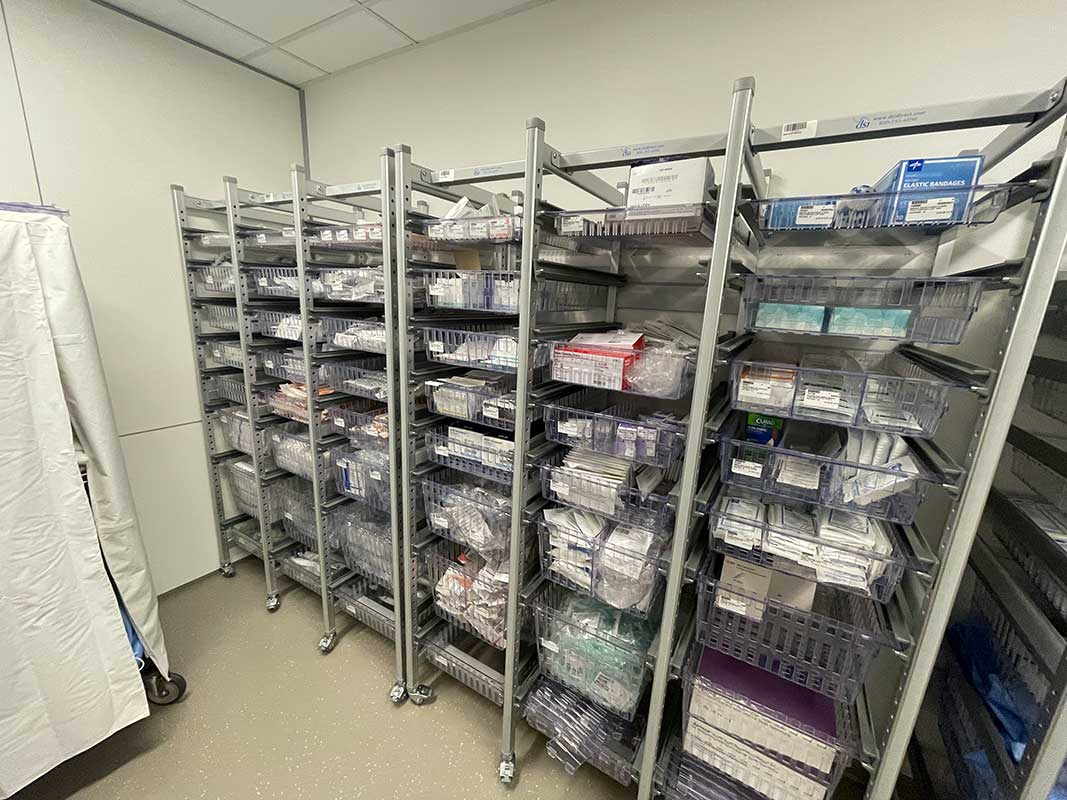
A materials management overhaul restructures hospital supply chains to reduce costs, improve clinical efficiency, and ensure regulatory compliance. Hospital supply chains typically represent 30-40% of total operating expenses, making systematic improvement essential for financial sustainability. The U.S. healthcare system loses approximately $25.7 billion annually to supply chain inefficiency, while nurses spend up to 60 minutes per shift searching for supplies. A complete overhaul addresses these losses through structured assessment, design, implementation, and sustained optimization phases. Distribution Systems International's storage and workflow services support every phase of this transformation.
A materials management overhaul is a systematic transformation of hospital supply chain operations from procurement through point-of-use delivery. This transformation targets inventory optimization, workflow optimization, space utilization, and clinical time recovery. The healthcare supply chain directly impacts both cost structure and patient safety outcomes.
Hospitals with poor supply chain practices experience 13% higher rates of medical errors and adverse outcomes. The AHRMM Cost, Quality, and Outcomes movement connects supply chain decisions to total cost of ownership, care quality, and reimbursement.
The healthcare supply chain accounts for roughly 30-40% of total operating costs, making it the second-largest expense category. The U.S. healthcare system loses an estimated $25.7 billion annually due to supply chain inefficiency. Hospitals with inadequate supply chain practices report 13% higher medical error rates and adverse patient outcomes.
The AHRMM Cost, Quality, and Outcomes movement pushes decision-making beyond unit price toward total ownership cost and clinical quality. Nurses spend up to 60 minutes per shift hunting for supplies, reducing direct patient care time.
The primary goal is reducing total supply expense while improving clinical access and patient safety. Secondary objectives include inventory optimization, space recapture, labor recovery, and regulatory compliance readiness. Programs target 5-7% annual supply cost reduction and 15-25% inventory holding decreases.
Fill rates should reach 99.9% while expiration rates drop below 1% of supply spend. Clinical time spent on supply tasks can be reduced by up to 50%.
AHRMM recommends supply expense per case-mix-index-adjusted discharge as the primary cost metric. HCAHPS survey scores measure quality impact from improved supply availability and reduced workflow disruption. Fill rate, stockout incidents per 1,000 inpatient days, and expiration rates track operational performance.
Compliance rates with new systems and staff satisfaction scores measure adoption and sustainability. Labor hours dedicated to supply tasks quantify clinical time recovery.
A materials management overhaul follows four sequential phases: Assessment, Design and Planning, Implementation, and Post-Implementation. Each phase builds on the previous one to ensure measurable results and sustained improvement. The Assessment phase quantifies baseline performance and establishes the business case for transformation.
Design and Planning converts diagnosis into data-driven target-state specifications with quantified ROI projections. Implementation executes the physical installation, inventory transfer, and staff training while minimizing operational disruption.
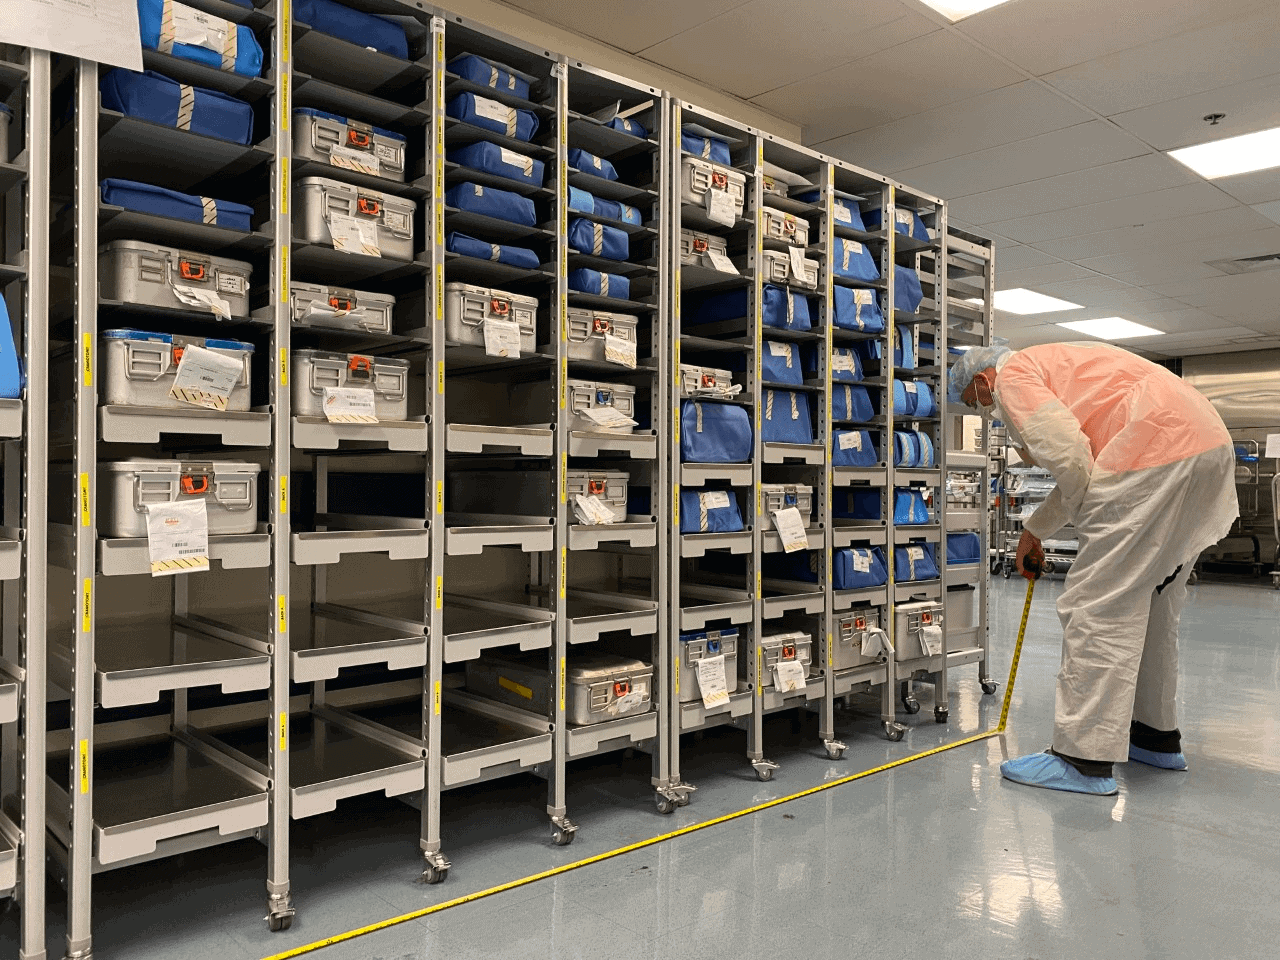
The Assessment phase captures on-hand value, PAR levels, usage velocity, and expiration exposure through physical count and ERP data. Workflow time-motion studies measure minutes staff spend searching, walking, restocking, and counting through direct observation and shift logging. Space utilization measurement captures square footage consumed by storage system redesign through physical measurement and CAD baseline documentation.
Stakeholder interviews capture pain points and constraints through structured discussions and value-stream mapping. Cross-functional mapping workshops identify end-to-end flow and bottlenecks across departments.
The Design phase creates detailed CAD-based drawings of proposed high-density, mobile, and point-of-use layouts. PAR-level recalculation resets minimum and maximum quantities using historical usage data rather than legacy estimates. Product standardization decisions reduce SKU variation and rationalize physician preference cards to eliminate unnecessary cost.
Vendor evaluation and consolidation narrow the supplier base and negotiate volume terms aligned with GPO contracts. Change management communication planning defines the rationale, identifies unit champions, and establishes training and go-live schedules.
Implementation launches through phased rollout, typically starting with one or two departments before expanding facility-wide. Inventory transfer and relabeling migrate stock into new bins and shelving with FIFO-enforcing labels to prevent expiration. Staff training delivers role-based instruction before go-live, with a no-training, no-access discipline reducing post-launch errors.
Go-live support provides on-site or on-call assistance during the first weeks plus Gemba-audit periods. Procurement and delivery sequencing stages equipment arrival to match installation order and minimize disruption.
Post-implementation performance depends on continuous measurement, adjustment, and capability transfer to internal teams. Thirty, sixty, and ninety-day audits compare results against pre-launch baselines to validate ROI claims. PDSA cycles and recurring Gemba audits identify improvement opportunities before problems escalate.
KPI dashboards track fill rate, stockout incidents, labor hours, and expiration waste in real time. Capability transfer ensures internal experts independently operate and improve the system without permanent external support.
BJC HealthCare achieved a 99.9% fill rate following their system transformation across twelve facilities. Stockout rates baseline at approximately 0.04 per 1,000 inpatient days and approach near-zero post-implementation. Expiration rates should drop below 1% with proper visibility and FIFO enforcement.
System compliance improved from 76% to 95% in a documented three-year study. Staff satisfaction scores rose from 79% to 90% during the same period.
Month zero typically shows a compliance and satisfaction dip due to disruption and the learning curve. This temporary decline is normal and resolves through hyper-care support and Gemba audits that dial in bin quantities. Compliance rises steeply between months one and six as the system becomes self-managing at the frontline.
Programs that withdraw support during the initial dip are those most likely to stall. Sustained on-site presence through the first 90 days stabilizes adoption and proves internal teams can operate independently.
The Year-3 Stall occurs with very high frequency when pilot success depends on heroic effort by small teams. Energy wanes, dedicated resources disappear, and competing priorities displace the program without right-sized staffing. Absence of stakeholder buy-in prevents improvement when consensus fails among clinical, finance, and procurement leadership.
Staff hoarding and workarounds emerge from inconvenient placement and poor point-of-use design. PAR levels carried forward from legacy systems without recalculation from real usage negate inventory optimization gains.
Investment components split into equipment, installation, professional services, and optional technology layers. Process-first visual systems cost substantially less than automated dispensing or RFID because they avoid IT integration. BJC HealthCare's full system transformation cost approximately $6.70 million for twelve facilities, delivering a 7.9x ROI.
Automated dispensing cabinets carry a total cost of ownership between $3.6 million and $7.6 million-plus over ten years. RFID pilots cost approximately $15,000-$50,000 for single-zone validation before full deployment.
BJC HealthCare invested approximately $6.70 million for a complete twelve-facility transformation using process reengineering and visual replenishment. Automated dispensing cabinets require $3.6 million to $7.6 million-plus in total cost over ten years. RFID pilot implementations cost approximately $15,000-$50,000 for single-zone validation.
Disposable UHF RFID tags cost $0.08-$0.50 per unit while reusable asset tags run $2-$8 each. Reusable tags offer 5-10 year lifespans, reducing long-term tag replenishment costs.
| Technology Type | Typical Investment | ROI / Notes |
| Process-first visual systems (2-Bin KANBAN) | Lower cost; no IT integration required | Break-even inside 12 months; 5-7% supply cost reduction |
| Full-facility transformation (BJC HealthCare, 12 facilities) | Approximately $6.70 million | 7.9x ROI; $12.8 million in annual recurring savings |
| Automated dispensing cabinets | $3.6 million-$7.6 million-plus over 10 years | Total cost of ownership; often underdelivers on everyday supply management |
| RFID pilot (single-zone validation) | Approximately $15,000-$50,000 | Tags run $0.08-$0.50 disposable or $2-$8 reusable (5-10 year lifespan) |
BJC HealthCare achieved a 7.9x ROI with $12.8 million in annual recurring savings at 3% expense reduction. Reduced inventory holdings deliver 15-25% decreases in on-hand value and proportional carrying cost reductions. Lower supply expense reaches 5-7% annual reduction through improved utilization and standardization.
Clinical time on supply tasks can be reduced by up to 50%, returning hours to direct patient care. Supply-room space decreases by approximately 25%, freeing valuable square footage for revenue-generating or patient care activities.
Nurse supply-hunting represents a $14 billion annual productivity drain across the healthcare system. Clinical search-and-walk time consumes up to 30% of a nurse's shift, exceeding two hours per day. Med-surg nurses often spend only 30% of their time on direct patient care due to supply disruptions.
Approximately 25% supply-room space reduction avoids new construction costs ranging from $250-$800 per square foot. Labor hour reduction returns up to 50% of clinician supply time to patient-facing activities and reduces burnout.
Project duration scales with facility size, department count, and technology complexity from weeks to multiple years. Single-department retrofits stabilize within 2-4 months total from assessment through post-implementation audits. Multi-department overhauls require approximately 6-9 months to reach stabilized performance with full capability transfer.
Full-facility and multi-site transformations span 12-18+ months from initial assessment to sustained independent operation. Technology-heavy deployments with HMS or EHR-style integration extend timelines through discovery, configuration, testing, and training phases.
Single-department retrofits reach a stabilized state in approximately 2-4 months from assessment through post-implementation. Multi-department overhauls span roughly 6-9 months total, including phased rollout and performance validation. Full-facility and multi-site transformations require 12-18+ months to achieve sustained results across all departments.
Technology-heavy hospital system deployments follow structured phases: Discovery 4-6 weeks, Configuration 8-12 weeks, Testing 4-6 weeks, Training 4-6 weeks, Go-live 2-4 weeks. Visual 2-bin Kanban systems move from site assessment to operational system in weeks, not months per unit.
| Facility Scope | Typical Duration | Notes |
| Single-department retrofit | 2-4 months | Assessment through post-implementation audits |
| Multi-department overhaul | 6-9 months | Includes phased rollout and performance validation |
| Full-facility or multi-site transformation | 12-18+ months | Sustained results across all departments |
| Technology-heavy deployment (HMS/EHR integration) | Varies by phase | Discovery 4-6 wks, Configuration 8-12 wks, Testing 4-6 wks, Training 4-6 wks, Go-live 2-4 wks |
Process-first visual systems cost far less than automated dispensing or RFID because they avoid IT integration complexity. Automated dispensing cabinets often underdeliver on everyday supplies compared to process-first approaches that emphasize physical workflow. Process-first programs break even inside 12 months while ADC-only implementations show weak ROI on everyday supply management.
Phased rollouts launch one or two departments, stabilize performance, then expand facility-wide to contain risk. Big-bang cutovers accelerate timelines but increase disruption and demand intensive hyper-care support during the initial weeks.
FIFO is a physical inventory rotation method placing newer stock behind older items to prevent expiration. Proper FIFO enforcement through plastic bins and labeling reduces expiration rates from 8-10% toward under 1% of supply spend. Hyper-care provides on-site or on-call support during the first weeks after go-live when questions and adjustments peak.
PAR levels are minimum and maximum quantities set for each inventory item based on usage patterns. Recalculating PARs from historical data rather than carrying forward legacy estimates is the highest-leverage design step.
Delaying a materials management overhaul compounds avoidable losses year after year without intervention. Typical hospital supply inventory is overstocked by 20-50% due to severe stockout consequences and poor visibility. Expiration and obsolescence consume an industry-average 8-10% of supply spend, with some facilities losing 10-30% of products.
Approximately 40% of healthcare staff report having cancelled a case due to lack of supplies. Inventory carrying costs run 20-30% of average inventory value per year, making a $25 million inventory cost roughly $6.25 million annually.
Typical hospital supply inventory is overstocked by 20-50% beyond actual usage requirements due to poor visibility. Expiration and obsolescence runs an industry-average 8-10% of supply spend, with some facilities experiencing 10-30% product expiration. Roughly 40% of healthcare staff report cancelling cases due to supply unavailability, creating revenue loss and patient dissatisfaction.
Inventory carrying costs consume 20-30% of average inventory value annually in capital, storage, insurance, and obsolescence. About 50% of hospitals cannot proactively identify and manage expired supplies before write-off.
Holding a $25 million inventory costs roughly $6.25 million annually in carrying expenses without delivering patient care value. Cost-of-inaction for nursing time approaches $4 million annually for a 300-bed hospital with 800 FTEs at $40 per hour. Excess inventory carrying cost adds $6.25 million on $25 million inventory through capital, storage, and obsolescence.
Expiration and obsolescence losses reach $8-10 million on $100 million annual spend without proper rotation and visibility. Each year of delay repeats the full annual leak without capturing improvement benefits.
Cost-of-inaction calculators aggregate nursing time waste, excess inventory carrying cost, expiration losses, and rush-order premiums into annual totals. Multiplying annual losses by delay years demonstrates compounding financial impact when facilities postpone change management healthcare initiatives. OR cost-per-minute ranges from $36-$37 on average, with estimates reaching $100+ depending on inclusions and specialty.
Space valuation inputs convert reclaimed square footage into dollar savings using construction costs of $250-$800 per square foot. Reclaimed storage space either avoids new construction or frees revenue-generating area for patient care expansion.
Dedicated resources represent the highest-impact success factor, preventing the Year-3 Stall when programs rely on small teams. Clinical and cross-functional buy-in ranks second because improvement stalls without consensus among clinical, finance, and procurement leadership. PAR-level recalculation from real usage data rather than legacy estimates drives carrying-cost and stockout gains.
Point-of-use design and convenient placement prevent staff hoarding and workarounds that undermine new systems. Data, KPI dashboards, and Gemba audits surface problems before escalation while proving ROI to stakeholders.
Most traditional lean programs do not achieve meaningful sustained results by year five without addressing resource allocation. No sustainability mechanism or premature handoff occurs with high frequency when support withdraws before internal teams prove independent operation. Thirty-sixty-ninety-day performance audits measure results against pre-launch baseline to validate ROI and identify adjustment opportunities.
Continuous improvement cycles using PDSA and Model for Improvement methodologies sustain gains beyond initial implementation. KPI dashboards track fill rate, stockout incidents, labor hours, and expiration waste to maintain visibility and accountability.
Weak baseline data prevents proving ROI later with medium frequency because programs skip time-motion studies and pre-launch KPI establishment. Budget overruns occur with medium frequency because tech-heavy builds routinely exceed estimates by 30-50% without disciplined scope control. Absence of stakeholder recognition and consensus among clinical, finance, and procurement teams stalls improvement initiatives before launch.
Programs that secure buy-in early through value-stream mapping and track systems demonstrations reduce resistance and accelerate adoption. Executive sponsorship and CQO framing tie supply chain transformation to cost, quality, and reimbursement outcomes that resonate with leadership.
Post-implementation capability transfer ensures internal experts run and improve the system independently without permanent external support. Programs that withdraw support before internal teams demonstrate sustained independent operation face high risk of the Year-3 Stall. Certification programs and train-the-trainer approaches build internal expertise that outlasts initial implementation teams.
Documentation, standard work, and ongoing audit protocols maintain system integrity as staff turnover occurs. Internal champions who understand the why behind changes become advocates who sustain momentum through organizational transitions.
A successful materials management overhaul integrates Assessment, Design, Implementation, and Post-Implementation phases into a cohesive transformation program. Process-first approaches using visual replenishment and Kanban deliver 5-7% supply cost reduction, 15-25% inventory cuts, and break-even within 12 months. Programs that recalculate PAR levels from real usage, secure cross-functional buy-in, and maintain dedicated resources through year three achieve sustained results.
The cost of inaction compounds annually through nursing time waste, excess inventory carrying cost, expiration losses, and supply-driven case cancellations. Organizations that quantify these avoidable losses build compelling business cases for immediate action rather than delayed improvement.
Distribution Systems International has supported acute-care facilities through complete materials management transformations since 1990, using LEAN methodology and 2-bin KANBAN systems to deliver measurable ROI. Their consultative approach begins with complimentary on-site analysis, progresses through CAD-based design and turnkey implementation, and includes after-sales support that addresses the Year-3 Stall. By focusing on process reengineering before technology, facilities achieve faster payback and sustained clinical time recovery.
Every month a materials management overhaul is delayed, hospitals absorb avoidable costs from excess inventory, expired supplies, and lost clinical time. Distribution Systems International has guided acute care facilities through complete materials management transformations since 1990, combining LEAN methodology, 2-Bin KANBAN systems, and turnkey implementation support from assessment through post-implementation audits. Call (800) 393-6090 to speak with a storage specialist, or request a complimentary storage assessment to get a custom quote for your facility.
A materials management overhaul is a systematic transformation of hospital supply chain operations, covering everything from procurement through point-of-use delivery. It follows four sequential phases: Assessment, Design and Planning, Implementation, and Post-Implementation. The goal is to reduce supply costs, recover clinical time, and support regulatory compliance.
Project duration depends on facility size and scope. Single-department retrofits typically stabilize in 2-4 months, multi-department overhauls take 6-9 months, and full-facility or multi-site transformations run 12-18+ months. Technology-heavy deployments extend timelines further through discovery, configuration, and testing phases.
Costs vary by scope and technology. Process-first visual systems, such as 2-Bin KANBAN, cost substantially less than automated dispensing cabinets or RFID because they avoid IT integration. BJC HealthCare's twelve-facility transformation cost approximately $6.70 million, while automated dispensing cabinets can run $3.6 million to $7.6 million or more in total cost of ownership over ten years.
Process-first programs typically deliver 5-7% supply cost reduction and 15-25% inventory cuts, with break-even inside 12 months. BJC HealthCare achieved a 7.9x ROI with $12.8 million in annual recurring savings. Clinical time spent on supply tasks can drop by up to 50%, returning hours to direct patient care.
Distribution Systems International has supported acute care facilities since 1990 with a consultative, three-step process: complimentary on-site analysis, CAD-based design and engineering, and full turnkey implementation. Their approach includes PAR-level recalculation, staff training, and after-sales support designed to prevent the Year-3 Stall and sustain results long-term.
With 21 years of sales management, marketing, P&L responsibility, business development, national account, and channel management responsibilities under his belt, Ian has established himself as a high achiever across multiple business functions. Ian was part of a small team who started a new business unit for Stanley Black & Decker in Asia from Y10’ to Y14’. He lived in Shanghai, China for two years, then continued to commercialize and scale the business throughout the Asia Pacific and Middle East regions for another two years (4 years of International experience). Ian played college football at the University of Colorado from 96’ to 00’. His core skills sets include; drive, strong work ethic, team player, a builder mentality with high energy, motivator with the passion, purpose, and a track record to prove it.