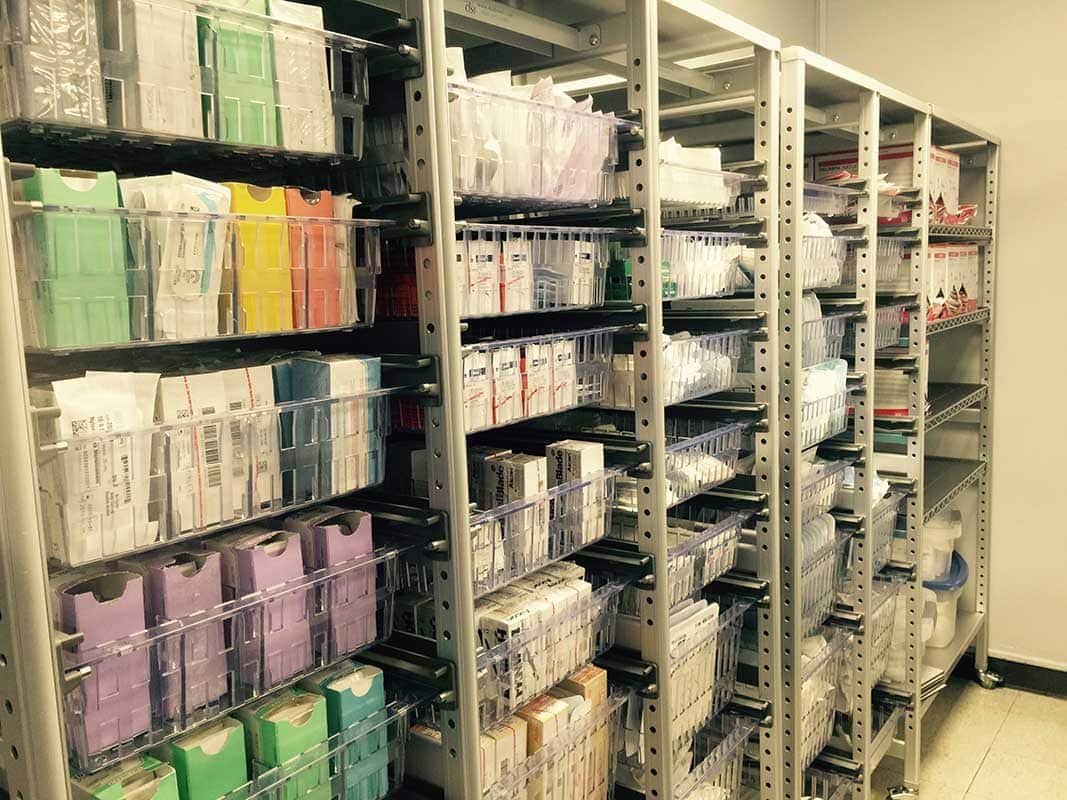
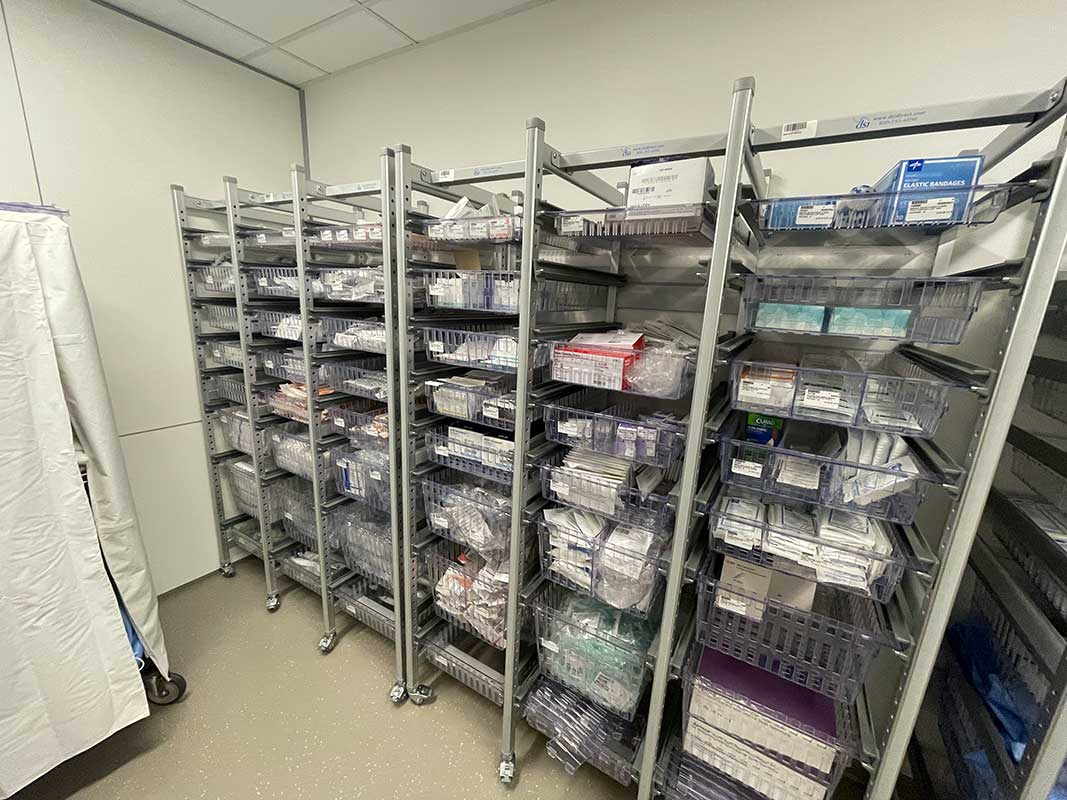
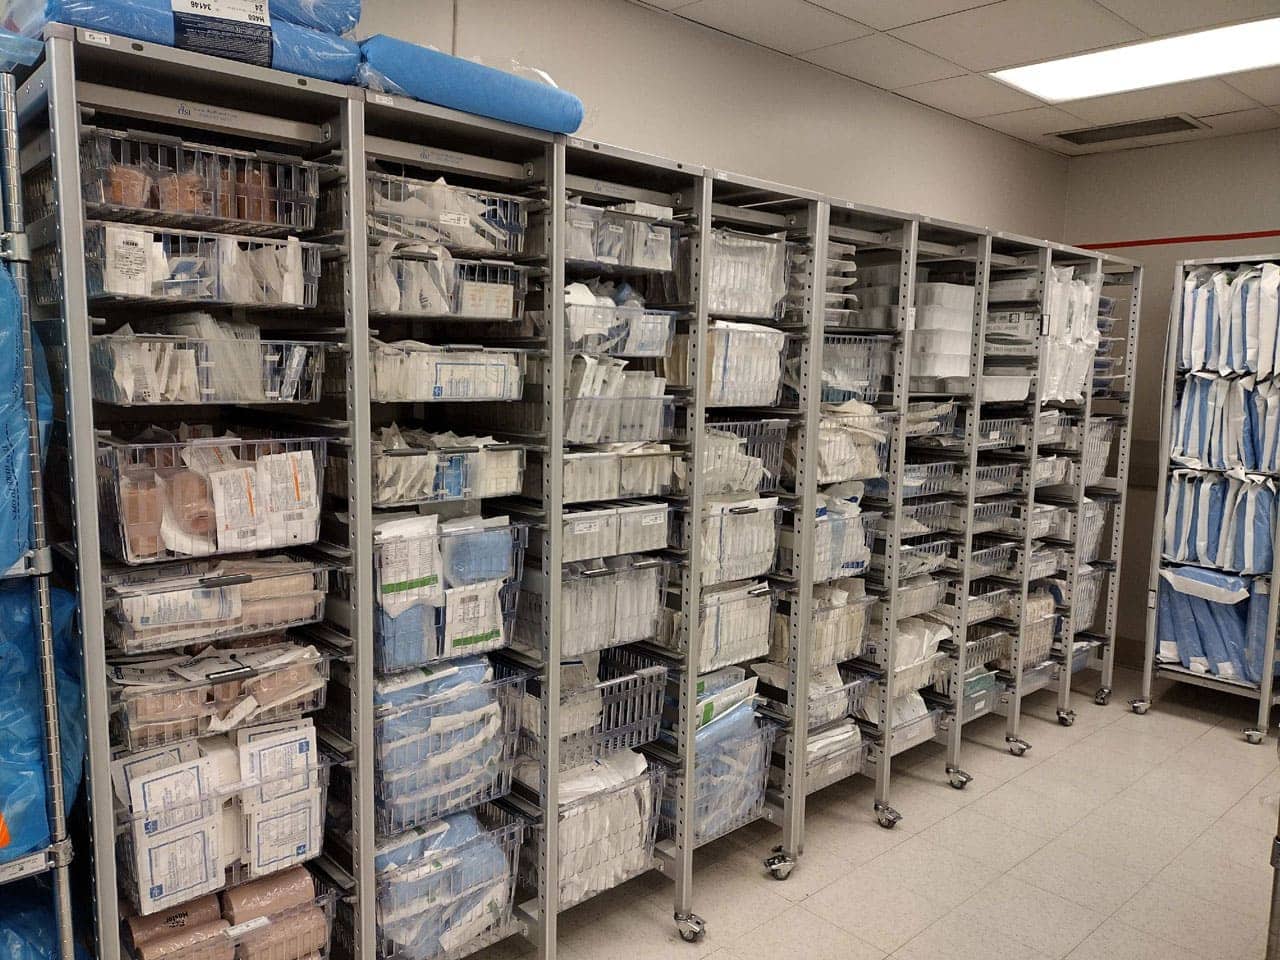
Hospital leaders face mounting pressure to control supply chain expenses while maintaining clinical quality and regulatory compliance. Materials management optimization represents a strategic investment that addresses both imperatives by reducing waste, improving workflow efficiency, and enabling data-driven inventory control. Understanding the complete cost structure, from initial assessment through long-term sustainability, empowers decision-makers to evaluate budgeting storage solutions against documented return benchmarks. This analysis examines investment ranges, payback timelines, and critical success factors separating programs achieving sustained ROI from those that stall after initial improvements.
Here's what we break down: the core cost components across capital and operational spend, how ROI is calculated within typical payback windows, the critical success factors separating sustained programs from stalled ones, and what department-level savings look like once optimization reaches full scale. Facilities evaluating a Materials Management overhaul can use these benchmarks to model their own baseline before committing budget.
Materials management optimization transforms how hospitals procure, store, and deliver clinical supplies to point-of-use locations. The process replaces legacy manual systems with data-driven workflows that reduce carrying costs, eliminate stockouts, and return clinical time to patient care. The AHRMM Cost, Quality, and Outcomes movement links supply expense per case-mix-adjusted discharge with HCAHPS survey scores.
Supply chain efficiency directly affects financial performance and clinical outcomes across acute care facilities. Optimization initiatives typically follow four phases: assessment, design and planning, implementation, and post-implementation sustainability with continuous improvement.
A comprehensive materials management overhaul begins with a current-state inventory audit via physical count, cycle-count sampling, and ERP data extraction. Workflow time-motion studies capture minutes staff spend searching, walking, and restocking through direct observation. CAD-based storage layout engineering produces detailed drawings visualizing the transformed space before equipment ships.
PAR-level recalculation replaces legacy guesses with calculations from historical usage data. Phased rollout strategies launch one or two departments first, stabilize operations, then expand facility-wide to contain risk and refine processes.
Hospital supply chain accounts for 30 to 40 percent of total operating costs, making it the second-largest expense category. The U.S. healthcare system loses an estimated $25.7 billion per year to supply chain inefficiency. Nurses spend up to 60 minutes per shift hunting for supplies, with some studies documenting search time consuming 30 percent of a shift.
Roughly 40 percent of healthcare staff report cancelled cases due to lack of supplies. Hospitals with poor supply chain practices demonstrate 13 percent higher rates of medical errors and adverse outcomes, directly linking materials management cost control to patient safety.
AHRMM recommends supply expense per case-mix-index-adjusted discharge and HCAHPS survey score as headline metrics linking cost to quality. Fill rate targets reach 99.9 percent in optimized systems like BJC HealthCare's documented transformation. Baseline stockout rates of 0.04 per 1,000 inpatient days should approach near-zero post-implementation.
Expiration targets under 1 percent become achievable with proper visibility and FIFO enforcement. Compliance baselines of 76 percent typically climb to 95 percent as staff adopts the new system.
Core cost components divide into capital investments, ongoing operational expenses, and technology layer choices. Capital investments include storage equipment such as medical carts, high-density shelving, and installation labor. Ongoing costs encompass software maintenance at 15-20 percent of license fees annually and hardware support at 10-15 percent of hardware costs.
Technology choices create the widest cost variance, from process-first visual systems to automated dispensing cabinets. Process-first approaches avoid IT integration complexity and deliver faster time-to-value with lower total cost of ownership.
The table below outlines typical investment ranges by technology and scope.
| Investment Type | Cost Range | Notes |
| RFID pilot (single zone) | $15,000-$50,000 | Validates ROI before full deployment |
| Automated dispensing cabinets (10-year TCO) | $3.6M-$7.6M+ | Highest total cost of ownership among common options |
| Full system transformation (12-facility case study) | ~$6.70M | BJC HealthCare's documented full-scale rollout |
Consumable RFID tags for day-to-day tracking cost $0.08 to $0.50 per tag, while reusable asset tags built for a 5 to 10 year life run $2 to $8 per tag.
Software maintenance costs approximately 15-20 percent of license fees annually, while hardware support runs 10-15 percent of hardware investment. Reduced inventory holdings deliver a 15 to 25 percent decrease with 2-bin Kanban systems. Lower supply expense produces a 5 to 7 percent annual reduction through optimized PAR levels and reduced waste.
Labor efficiency gains reach 30 percent operational improvement with up to 50 percent of clinician supply time returned to direct patient care. Space recapture averages 25 percent supply-room space reduction, freeing square footage for revenue-generating clinical use.
Process-first visual systems like Kanban cost far less than automated dispensing or RFID because they avoid IT integration complexity. 2-bin Kanban systems move from assessment to operational in weeks versus months for HMS/EHR-style deployments. Tech-heavy builds routinely exceed budget by 30 to 50 percent due to integration challenges and scope creep.
AHRMM Cost, Quality, and Outcomes movement pushes supply chain decisions past unit price toward total cost of ownership analysis. Kanban requires no IT infrastructure upgrades or heavy system integration compared to technology-dependent deployments demanding network upgrades and database connectivity.
ROI analysis for healthcare projects combines direct financial savings with operational improvements and quality enhancements. The calculation weighs inventory reduction, labor recovery, space recapture, and waste elimination against upfront investment and ongoing costs. Hard-dollar savings appear in reduced carrying costs, lower supply expense, and freed staff hours.
Payback periods vary by project scale and technology choices, with process-first programs typically breaking even within 12 months. Programs capturing baseline data during assessment prove ROI through documented before-and-after KPI comparisons.
The table below shows where materials management optimization savings typically originate.
| Savings Driver | Share of Total Benefit | Primary Mechanism |
| Inventory reduction | ~35% | Freed capital, avoided obsolescence write-offs |
| Labor recovery | ~30% | Returned clinical time and efficiency gains |
| Waste elimination | ~20% | Reduced expiration, fewer rush orders, product standardization |
| Space recapture | ~15% | Freed revenue-generating square footage, avoided construction |
Inventory carrying costs run 20 to 30 percent of average inventory value annually, making inventory reduction a high-impact lever.
Kanban programs report 3x to 7x ROI within the first year for single-department implementations. BJC HealthCare achieved payback under 12 months across their 12-facility transformation. RFID deployments document 10.2-month payback for 600-bed hospitals with 327% three-year ROI.
Pharmacy RFID implementations achieve payback in 5-15 months with 4x-20x three-year ROI depending on inventory value. BJC HealthCare's transformation reached full ROI within 36 months, generating approximately $15M annually in sustained savings by year three.
Weak baseline data prevents ROI proof because pre-launch KPIs were never captured through time-motion studies. No stakeholder buy-in occurs when clinical, finance, and procurement teams lack consensus. PAR levels not recalculated from real usage remain a failure when optimization investment carries forward legacy guesses.
Budget overrun affects tech-heavy builds as IT integration demands exceed initial estimates by 30-50 percent. Legacy PAR levels carried forward without recalculation undermine the single highest-leverage design step.
Critical success factors determine whether programs sustain gains beyond initial 12-18 months or fall victim to the Year-3 Stall. Dedicated resources prevent reliance on heroic effort by small teams whose energy wanes under competing priorities. Clinical and cross-functional buy-in ensures stakeholders recognize the problem and commit to the solution.
PAR-level recalculation from real usage data drives carrying-cost and stockout gains more than any other design decision. Point-of-use design and placement prevent hoarding and workarounds by making the system more convenient than manual alternatives.
Staff hoarding supplies or working around the new system occurs due to poor placement decisions. Up to 50 percent of clinical supply time can be returned to direct patient care when systems place inventory at point of use. Staff training must be role-based in low-stakes environments before go-live to reduce post-launch errors.
Go-live support during the first weeks provides on-site hyper-care while Gemba audits dial in bin quantities. Inconvenient placement leads to poor design, causing the system to become more work than the legacy manual process.
Space utilization measurement via physical measurement and CAD baseline establishes square-footage reduction targets. Product standardization decisions reduce SKU variation and enable clinically equivalent substitutions at lower unit costs. Change management communication planning defines the "why," identifies unit champions, and sets training cadence before implementation.
Procurement and delivery sequencing stages equipment to match install order and minimizes operational disruption during cutover. Preference-card standardization for laparoscopic cholecystectomy delivered 32 percent per-case supply cost reduction even with optional physician adoption.
The Year-3 Stall affects programs when pilot success depended on heroic effort by a small team. Most traditional lean programs do not achieve meaningful sustained results by year five, according to AHRQ-referenced sustainability literature. No sustainability mechanism or premature handoff occurs when external support withdraws before internal teams prove independent operation.
Competing priorities displace the program after initial success when dedicated resources are reassigned. Continuous improvement cycles using PDSA or Model for Improvement methodology maintain momentum through recurring Gemba audits and KPI dashboards.
Implementation timelines directly influence both cash flow and the speed at which savings materialize. Single-department retrofits reach a stabilized state fastest, minimizing disruption while proving ROI before broader rollout. Multi-department overhauls balance risk containment with economies of scale as teams refine processes across launches.
Full-facility and multi-site transformations require the longest runway but deliver the largest absolute savings when scaled. Programs using track systems and modular components accelerate installation timelines compared to custom-fabricated solutions.
The table below summarizes typical implementation timelines by project scope.
| Project Scope | Typical Timeline | Notes |
| Single-department retrofit | 2-4 months | Fastest path to a stabilized state |
| Multi-department overhaul | 6-9 months | Sequenced launches balance risk and scale |
| Full-facility or multi-site transformation | 12-18+ months | BJC HealthCare's 12-facility program reached full ROI within 36 months |
Visual 2-bin Kanban systems move from assessment to operational in weeks, not months per unit. Technology-heavy HMS/EHR-style deployments require discovery, configuration, testing, training, and go-live phases spanning many months.
Phased rollout strategies launch one or two departments, stabilize operations, then expand facility-wide to contain risk. Month 0 go-live dip is normal as staff navigates the learning curve, and programs pulling support during the dip typically stall. Inventory transfer and relabeling with FIFO-enforcing labels prevents expiration by physically enforcing first-in-first-out rotation.
30-60-90 day performance audits against pre-launch baseline prove savings and identify refinement opportunities before moving to the next phase. Systems incorporating plastic bins enable rapid inventory transfer and visual management during cutover.
Gemba-audit periods dial in bin quantities and locations during the first weeks before the system runs independently. Recurring Gemba audits maintain discipline and surface problems before they compound into stockouts or compliance failures. KPI dashboards tracking fill rate, stockout incidents, labor hours, and expiration waste provide real-time visibility.
Capability transfer ensures internal experts run the system without permanent external support once performance stabilizes. Organizations maintaining dedicated resources avoid the Year-3 Stall by continuing improvement cycles rather than declaring victory after initial gains.
Soft benefits include staff burnout reduction, patient safety improvement, and accreditation readiness, which resist precise line-item valuation. Clinical search-and-walk time as high as 30 percent of a nurse's shift exceeds two hours per eight-hour shift. Med-surg nurses often spend only about 30 percent of time on direct patient care, with the remainder consumed by documentation and supply tasks.
Nurse supply-hunting represents a $14 billion annual productivity drain across the U.S. healthcare system. Hospitals with poor supply chain practices demonstrate 13 percent higher rates of medical errors and adverse outcomes, directly linking operational efficiency to clinical quality metrics affecting reimbursement.
Clinical search-and-walk time as high as 30 percent of a nurse's shift translates to more than two hours of unproductive activity. Med-surg nurses often spend only about 30 percent of time on direct patient care due to documentation burdens and supply hunts. Nurse supply-hunting costs approximately $14 billion annually in lost productivity across U.S. hospitals.
Hospitals with poor supply chain practices experience 13 percent higher rates of medical errors and adverse outcomes. Roughly 40 percent of healthcare staff report cancelled cases due to lack of supplies, directly affecting surgical throughput and revenue.
Typical hospital supply inventories are overstocked by 20 to 50 percent because stockout consequences outweigh carrying costs in staff perception. Expiration and obsolescence run an industry-average 8 to 10 percent of supply spend annually. Holding a $25M inventory costs roughly $6.25M annually in carrying costs at the 25 percent industry standard.
Nursing time on supply hunts costs approximately $4M annually for a 300-bed hospital with 800 FTEs at $40/hour. About 50 percent of hospitals cannot proactively identify and manage expired supplies, converting purchased inventory directly into waste.
Improved supply chain practices enhance accreditation readiness through visible expiration control and organized sterile storage. FIFO enforcement mechanisms prevent expired products from remaining accessible in clinical areas during Joint Commission surveys. Organized storage layouts demonstrate infection-control compliance and proper sterile-supply separation protocols.
Documented PAR levels and automated replenishment systems provide auditable evidence of supply-chain governance. Solutions from the product gallery often incorporate compliance features supporting regulatory requirements without adding administrative burden.
Department-level savings quantification provides granular detail needed for cost-benefit evaluation and budget justification. Inventory reduction converts holding costs into freed capital and avoids obsolescence write-offs. Labor recovery returns staff hours to revenue-generating clinical activities.
Space recapture frees square footage for revenue-generating clinical use or avoids new construction at $250-$800 per square foot. Waste elimination reduces expiration, rush orders, and procedure-specific supply excess.
HFMA-referenced surveys cite approximately 35 percent holding-cost reduction through optimized inventory management and PAR-level recalculation. Saint Luke's cut on-hand inventory from $3.2M to $2.7M through tighter controls and 2-bin Kanban implementation. Texas Children's Hospital saved $10M+ from tighter PAR management.
Labor hour reduction returns up to 50 percent of clinician supply time to direct patient care. BJC HealthCare documented $1.9M annual resource redeployment through operational efficiency gains.
Freed square footage averages approximately 25 percent supply-room space reduction with 2-bin Kanban implementations using modu-case mobile storage. Hospital construction runs $250 to $800 per square foot for new builds. Med-surg units cost $350 to $625 per square foot, making recaptured space worth hundreds of thousands in avoided construction.
Neurosurgery case waste averages approximately $968 per case, multiplying across surgical schedules into millions annually. One minute of OR time averages $36 to $37, making supply-driven delays measurable revenue losses.
BJC HealthCare achieved $12.8M annual recurring savings at 3 percent expense reduction across 12 facilities. BJC HealthCare documented $5.8M one-time inventory reduction by cutting excess holdings and expiration exposure. BJC HealthCare generates approximately $15M annually in sustained savings by year 3 as improvements compound.
Intermountain Healthcare reduced unnecessary supply cost by more than $2.5 million through preference-card rationalization. Texas Children's Hospital cut pharmacy inventory cost by $14M in a 3-month comparison through RFID-enabled visibility and automated replenishment.
Materials management optimization delivers measurable ROI when organizations invest in data-driven assessment, PAR-level recalculation, and sustained support. Process-first visual systems provide faster payback and lower total cost of ownership than technology-heavy builds because they avoid IT integration complexity. Programs that capture baseline data, maintain dedicated resources, and implement continuous improvement cycles avoid the Year-3 Stall.
The cost of inaction compounds annually as hospitals continue paying inventory carrying costs, expiration waste, and nurse productivity losses that optimization investment eliminates. Solutions featured in the application gallery demonstrate how strategic storage investments translate into sustained operational improvements. Organizations evaluating materials management cost transformation should model their specific baseline against documented benchmarks to quantify facility-specific ROI.
Distribution Systems International partners with acute care facilities to transform supply chain operations through consultative assessment, custom engineering, and turnkey implementation. Comprehensive solutions address department-specific challenges while delivering system-wide efficiency gains.
Distribution Systems International partners with Materials Management, SPD, and OR leaders to turn this cost and ROI framework into a facility-specific plan. The process starts with a complimentary on-site assessment, followed by CAD-based layout design, PAR-level recalculation, and a documented ROI projection before any capital commitment is required. Call (800) 393-6090 or request a quote to schedule a consultation and see how a materials management optimization program performs against your facility's own baseline.
Investment ranges widely depending on scope and technology. A single-zone RFID pilot starts around $15,000 to $50,000, while a full multi-facility transformation like BJC HealthCare's 12-facility program runs closer to $6.70 million. Process-first systems such as 2-bin Kanban sit at the lower end of the range because they avoid IT integration costs. Facilities typically start with a complimentary assessment to scope their own investment range before committing budget.
Most process-first programs reach payback within 12 months, with some single-department Kanban implementations reporting 3x to 7x ROI in the first year. RFID deployments in larger facilities have documented payback in as little as 10.2 months. Full multi-site transformations take longer to reach complete ROI, often around 36 months, but they also deliver the largest absolute savings once fully compounded across departments.
Process-first visual systems like 2-bin Kanban cost far less than automated dispensing cabinets because they skip IT integration, network upgrades, and database connectivity requirements. Automated dispensing cabinets carry a 10-year total cost of ownership between $3.6 million and $7.6 million or more, while Kanban systems move from assessment to operational in weeks rather than months. Facilities weighing both options should compare total cost of ownership, not just unit price, when scoping a project.
This pattern, sometimes called the Year-3 Stall, happens when early results depend on the heroic effort of a small team rather than a structured sustainability mechanism. Competing priorities can pull dedicated staff away once initial gains are visible, and programs that skip recurring Gemba audits or KPI dashboards lose the discipline that produced early savings. Continuous improvement cycles, such as PDSA, help facilities maintain momentum well past the first year.
ROI calculations weigh inventory reduction, labor recovery, space recapture, and waste elimination against upfront investment and ongoing costs. Programs that capture baseline data during the assessment phase, through time-motion studies and physical inventory counts, can prove savings with documented before-and-after comparisons. Inventory reduction and labor recovery typically account for the largest share of total benefit, so accurate baseline data on both is critical to a credible ROI calculation.
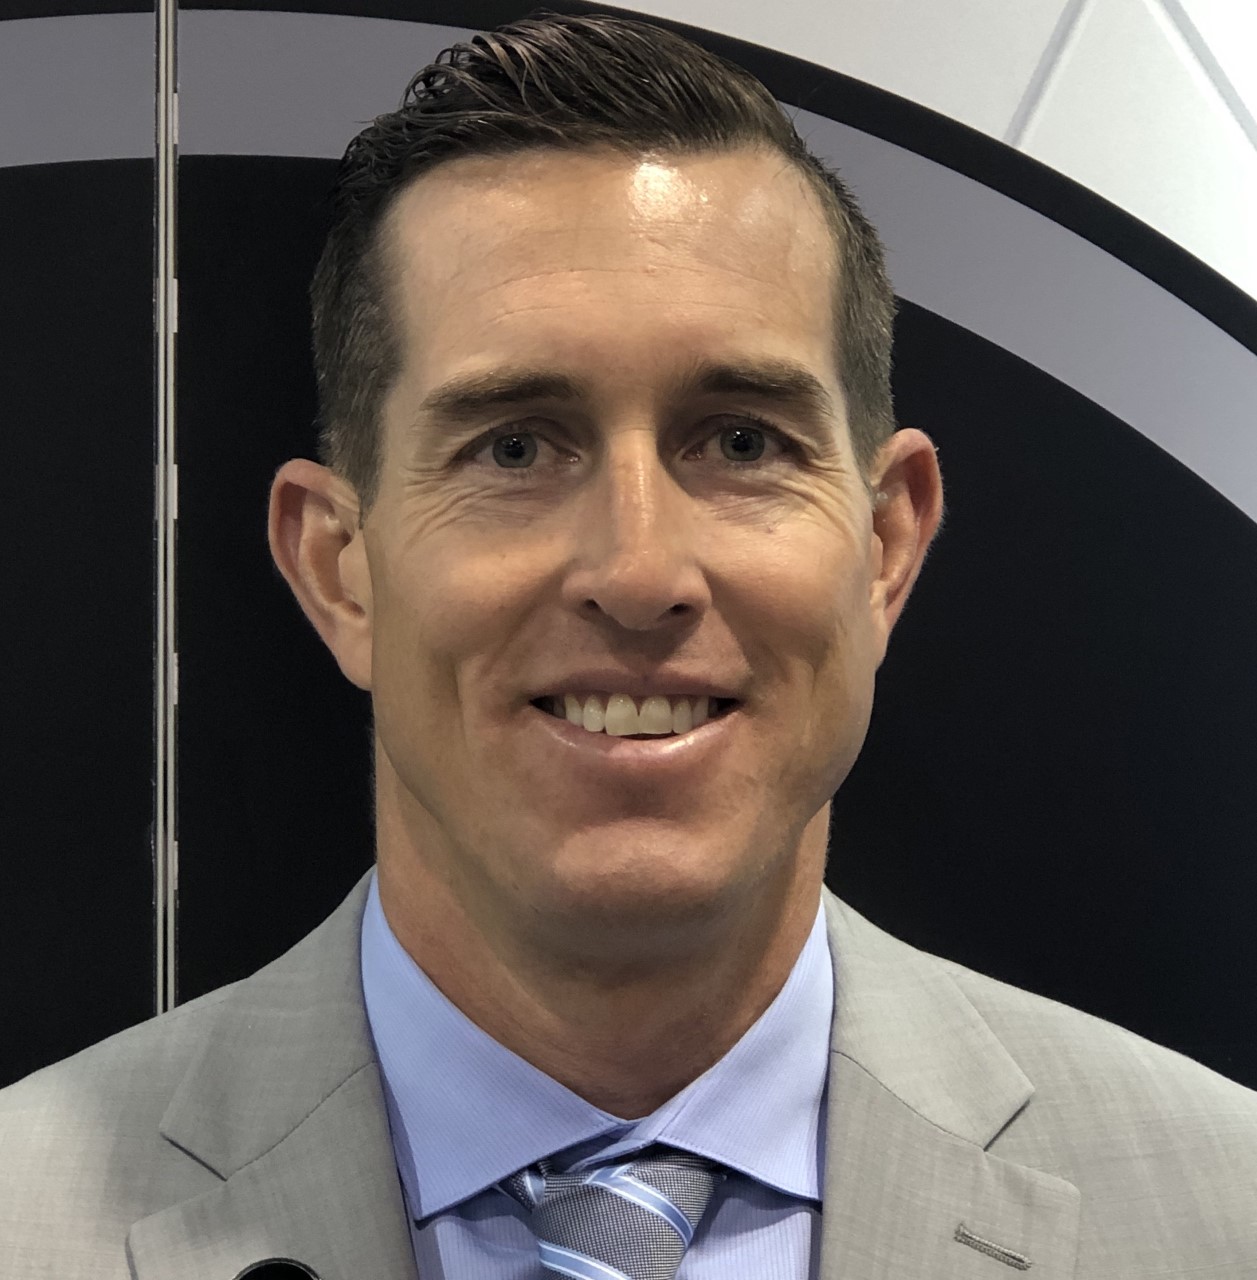
With 21 years of sales management, marketing, P&L responsibility, business development, national account, and channel management responsibilities under his belt, Ian has established himself as a high achiever across multiple business functions. Ian was part of a small team who started a new business unit for Stanley Black & Decker in Asia from Y10’ to Y14’. He lived in Shanghai, China for two years, then continued to commercialize and scale the business throughout the Asia Pacific and Middle East regions for another two years (4 years of International experience). Ian played college football at the University of Colorado from 96’ to 00’. His core skills sets include; drive, strong work ethic, team player, a builder mentality with high energy, motivator with the passion, purpose, and a track record to prove it.