Key Takeaways
A systematic approach to robotic instrument inventory starts with defining what you own, where it lives, and how you prove it's case-ready. Most programs skip this step, and spend the next five years chasing instruments, eating write-offs, and delaying cases.
This guide walks through scope definition, failure modes, risk prioritization, data capture requirements, and lifecycle tracking so your program can move from reactive firefighting to measurable inventory control.
Robotic inventory is not just instruments. It's everything that must converge, sterile, available, and documented, for a robotic case to start on time. Programs that define inventory narrowly miss entire categories of failure.
Here's what falls under the robotic inventory umbrella:
The scale is significant. Over 7,500 da Vinci systems are installed globally, more than 12 million procedures have been performed, and 2,000+ US hospitals now run robotic surgery programs. The breadth of SKUs, graspers, scissors, needle drivers, energy instruments, stapling systems, endoscopes, makes scope definition the essential first step.
Control isn't a feeling. It's a set of metrics you can audit. If you can't measure it, you don't have it.
| Control Dimension | Operational Definition | How Measured | Target |
| Availability (case-ready) | Every pick-list item present, sterile, and staged before patient enters room | Case-cart completeness audit | ≥ 98% |
| Accuracy (system vs. shelf) | System quantity and location match physical shelf | Cycle count variance | ≥ 95% (goal: 99%+ with automated tracking) |
| Traceability (lot/serial/expiration) | Every implant/regulated device has UDI captured and linked to patient case | Scan-capture rate report | 100% implants; ≥ 95% high-risk items |
| Waste (expiration/unused pulls) | Expired items removed before use; unused pulls returned same day | Monthly expiration write-off; return rate | < 2% write-off by value |
| Compliance (documentation) | All implant documentation complete within 24 hours | Open-record audit | 100% closed within 24 hours |
Robotic inventory doesn't break down because people are careless. It breaks down because the workflow has more moving parts than any manual system can reliably track.
Shadow inventory is stock that exists physically but not in your system. It's the single largest source of count discrepancies and duplicate purchasing. Here's where to look:
How to spot it: Open every drawer and compare to your system of record. Ask three staff where a specific item is stored, inconsistent answers signal shadow locations. Check for items with no barcode, label, or expiration date.
Not all inventory failures are equal. Case delays and compliance gaps cost the most and carry the greatest patient safety risk.
Compliance failures: Missing implant lot/serial, undocumented substitutions, incomplete preference cards, missing consignment paperwork, unclear chain-of-custody. A retained surgical instrument can cost $1.9 million in defense and settlement. X-rays for incorrect counts run $240–$300 each.
Cost-waste failures: Expirations, unused pulls, over-par inventory, duplicate stocking, rush shipping, unclaimed vendor credits. Facilities lose $100,000–$500,000 annually in inventory-related losses. Annual lost charges from instrument-associated delays range from $6.7M to $9.4M. Delayed cases cost over $2,000 per minute.
Traceability requires capturing the right data at the right point in the workflow. Miss a field and you have a gap. Miss a scan point and you have a ghost.
| Field | Why It Matters | Captured When |
| Item ID / SKU | System tracking and reorder triggers | Receiving / put-away (scan) |
| Location | Accurate picks; eliminates search time | Put-away; updated at every move |
| Quantity on hand | Reorder decisions and readiness checks | Every transaction |
| Expiration date | Prevents use of expired items; drives FEFO | Receiving |
| Reorder point / par | Triggers replenishment before stockout | Set at par review; adjusted quarterly |
| Last count date | Flags items overdue for count | Each cycle count |
| UDI Field | Source | Failure If Missing |
| Device identifier (DI) | Barcode scan (GS1 DataMatrix) | Cannot trace device to patient during recall |
| Lot number | Scan or manual entry | Entire batch unidentifiable during recall |
| Serial number | Scan or manual entry | Cannot isolate individual device in investigation |
| Expiration date | Scan or manual entry | Risk of implanting expired device |
| Case linkage | System-generated (case ID + patient MRN) | Implant documented but not linked to chart |
2D barcodes (GS1 DataMatrix) are the globally harmonized standard, encoding GTIN, lot, expiration, and serial in a single scan.
Robotic instruments have finite lives. Tracking use counts prevents in-service failures and ensures timely replacement.
| Instrument | Max Uses | Current Count | Next Action |
| EndoWrist Needle Driver | 10 | 7 | Flag for replacement at use 9 |
| EndoWrist Bipolar Forceps | 10 | 10 | Remove from service; refurbish or dispose |
| Vessel Sealer Extend | 10 | 4 | Continue tracking |
| 30° Endoscope | Annual service / per IFU | Time-based | Schedule preventive maintenance |
Reprocessing life is typically 15–20 uses. Instrument life can be extended 2–8× beyond prior limits through optimized usage, reducing price per use by 24%.
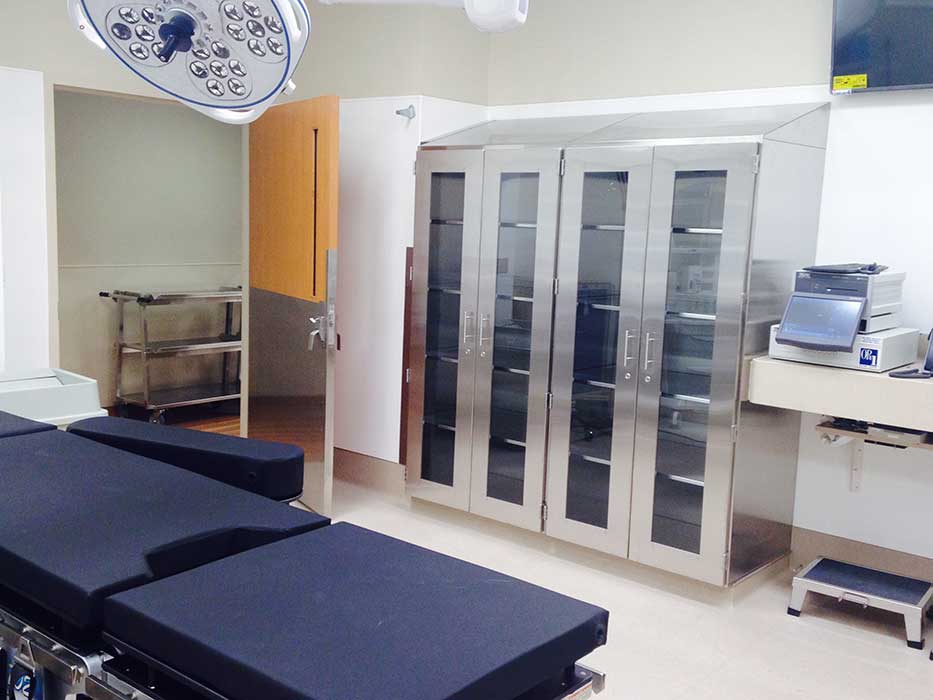
The wrong storage model doesn't just slow picks, it breeds shadow inventory and expiration waste. Choose based on program size, then enforce labeling discipline at the bin level.
| Model | Best For | Key Risk |
| Centralized core | High-volume programs (≥ 3 robotic ORs) | Bottleneck if understaffed; runner dependency |
| Decentralized (near-room) | Low-volume / single-robot programs | Shadow stock growth; items expire unnoticed |
| Hybrid (core + satellite) | Multi-specialty programs | Satellite becomes unmanaged second core |
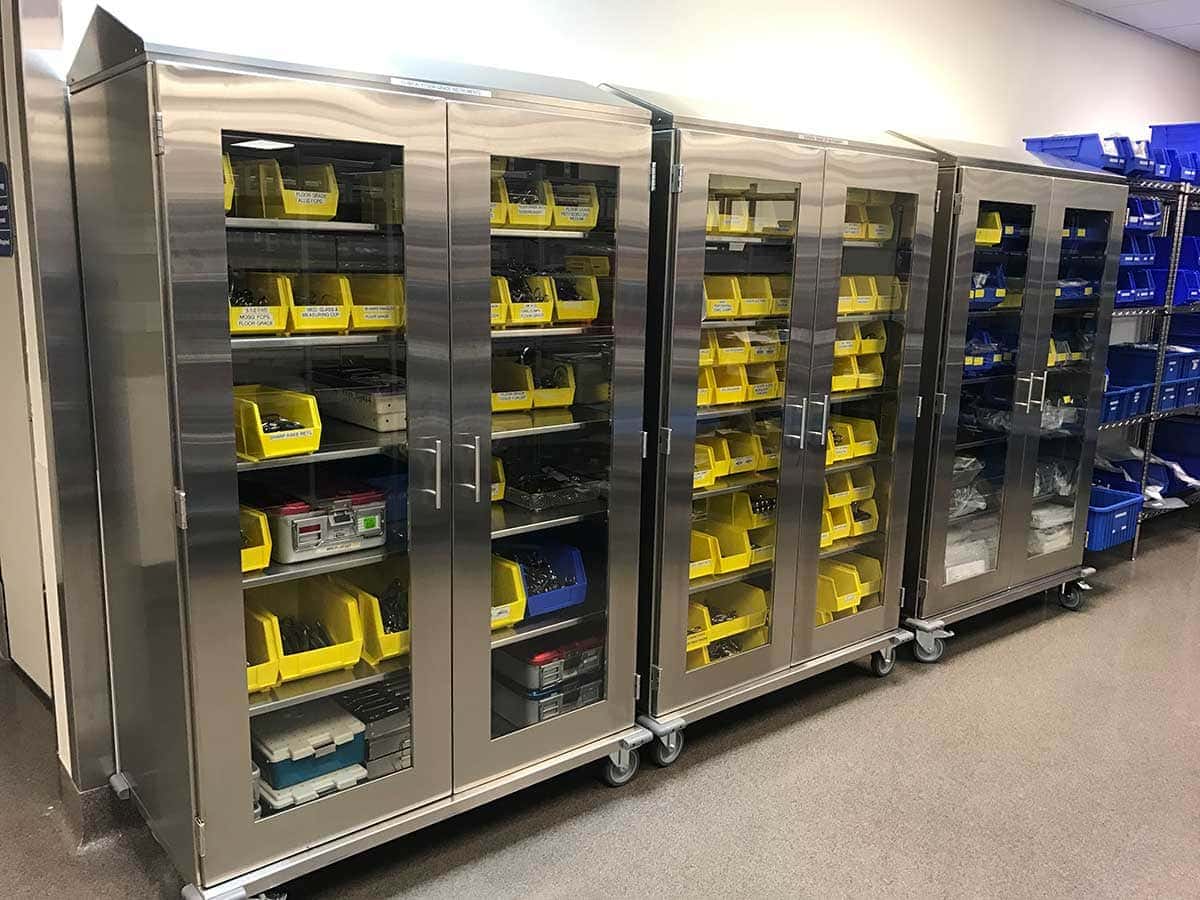
High-density vertical storage systems increase capacity by over 60%. Color-coded compartmentalized trays help staff identify errors 1.9 seconds faster than conventional labeling.
Every bin should pass a three-second glance test: right item, right quantity, not expired. Here's the checklist:
Standardization isn't about eliminating surgeon choice. It's about reducing SKU sprawl where variation adds cost but no clinical value, and protecting true preference items with a governed process. This is where supply chain optimization begins: fewer SKUs, less waste, faster picks.
| Item Type | Standardization Difficulty | Recommended Action |
| High-velocity disposables | Low | Standardize first; 1–2 SKUs per category |
| Common accessories | Low | Reduce to single platform-compatible option |
| Specialty preference items | High | Tier and cap; approved alternates with sunset review |
| Rare but critical items | Low | Do not standardize out; maintain safety stock |
Optimizing surgeon preference and instrument utilization can eliminate 40% of costs on robotic instruments. Tray size reduction is associated with up to 20% cost savings per procedure.
Par levels fail when they're set once and never revisited, or when staff build workaround stashes that defeat the system. The fix is tiered counting, hard caps, and a zero-tolerance policy on off-book inventory.
| Item Tier | Frequency | Variance Threshold | Escalation |
| Critical / implant | Weekly | Zero tolerance | Director + compliance if unresolved in 24 hours |
| High-cost (> $500) | Biweekly | ± 1 unit | Materials manager if pattern emerges |
| High-velocity | Monthly | ± 5% of par | Materials manager if recurs 3 months |
| Low-risk | Quarterly | ± 10% of par | None unless expiration found |
Inventory breaks at handoffs. When ownership is ambiguous, discrepancies go unresolved, credits get missed, and counts drift. Every step needs a named role and a defined output.
| Process Step | Owner | Key Output |
| Ordering | Materials coordinator | PO issued in ERP |
| Receiving | Receiving tech | Items inspected, lot/expiration recorded, inventory incremented |
| Put-away | Materials tech | Items in correct bin; scan-to-bin confirmed |
| Discrepancy resolution | Materials manager | Root cause identified; system adjusted |
| Step | Owner | Failure If Skipped |
| Pick + scan verify | OR core tech | Wrong item or quantity on cart |
| Pre-op readiness check | Circulating nurse | Missing/expired item found after patient prepped |
| Post-case reconciliation | OR core tech (closes within 4 hours) | Counts drift; credits missed |
| Implant/consignment reconciliation | Implant coordinator (within 24 hours) | Billing gaps; phantom inventory |
Implementation fails when teams skip the baseline. You can't fix what you haven't measured. Start with a full audit, then install checklists at the three critical touchpoints: before the case, during staging, and after the case closes.
Implementing a pit-stop model for robotic instrument logistics achieved a 46.4% reduction in OR turnover time (99.2 → 53.2 minutes). Room ready time dropped from 42.2 to 27.2 minutes.
If you're not tracking these numbers weekly, you're guessing. These KPIs cover the three dimensions that matter: readiness, traceability, and cost.
| KPI | Target | Review |
| Pick accuracy | ≥ 98% | Weekly |
| Stockout rate | < 2% | Weekly |
| Case-cart completeness | ≥ 97% | Weekly |
| Supply-related delay incidents | ≤ 1/month | Weekly |
| UDI capture rate (implants) | 100% | Monthly |
| Reconciliation closure | ≤ 4 hours routine; ≤ 24 hours consignment | Monthly |
| Expiration write-offs | < 1% inventory value/quarter | Monthly |
| Vendor credits captured | ≥ 95% | Monthly |
Tracking systems reduce instrument loss by 60–90%, cut manual counting from 4–8 hours per week to 1–2 hours, and typically pay back in 12–24 months. CensisAI² increases SPD productivity by 20%, processing 5,000 additional trays per month with existing staff.
Sustainability comes from sequencing. Lock locations and purge dead stock in week one. Standardize processes by day 60. Optimize on real data by day 90. Expand only when the system works without heroics.
Milestones: Day 2: expired items removed, temporary labels up. Day 4 , owners published, readiness checklist in use, first critical-item count done. Day 7 , location map finalized, first week of KPI data collected.
| Window | Goal | Key Actions |
| Days 1–30 (Stabilize) | Baseline controls | Lock locations, purge, label, assign owners, first full count, audit top 20 preference cards |
| Days 31–60 (Standardize) | Repeatable processes | Scan-based pick verification, par levels from 30-day data, preference card governance, post-case reconciliation SLA |
| Days 61–90 (Optimize) | Refine and prepare to scale | Adjust pars on 60-day trends, surgeon preference review, instrument lifecycle dashboard, pilot RFID if justified |
Full organizational overhaul takes 3–6 months. Organized systems reduce search time by 70–85%. The U.S. surgical instrument tracking market is growing at 10.8% CAGR (2024–2030), confirming scan-based workflows as the industry direction. For a detailed look at robotic instrument storage configurations, see DSI's storage layout guide.
Rule: Expand only when performance is repeatable without heroics; the system works on the worst-staffed shift, not just the best one.
RFID adoption context: Passive tags run $0.50–$2.50 each; handheld scanners $1,000–$4,500. Already 40–60% of robotic programs use automated tracking, growing 15–25% annually. Manual tracking accuracy sits at 75–85% versus 95–99%+ with automated systems. Choosing the right mobile cart and storage hardware is a key decision during this phase.
Robotic surgery inventory management is an operational discipline, not a storage problem. Programs that define scope, assign ownership at every handoff, enforce checklists at every case touchpoint, and track KPIs weekly eliminate the delays, write-offs, and compliance gaps that cost facilities hundreds of thousands annually. The tools exist, the data supports the ROI, and the implementation path is clear. What separates organized programs from chaotic ones is the decision to build a system and hold it accountable, starting this week, not next quarter.
Ready to bring structure to your robotic surgery inventory? Contact DSI to discuss storage solutions, organization strategies, and implementation support tailored to your program.
With 21 years of sales management, marketing, P&L responsibility, business development, national account, and channel management responsibilities under his belt, Ian has established himself as a high achiever across multiple business functions. Ian was part of a small team who started a new business unit for Stanley Black & Decker in Asia from Y10’ to Y14’. He lived in Shanghai, China for two years, then continued to commercialize and scale the business throughout the Asia Pacific and Middle East regions for another two years (4 years of International experience). Ian played college football at the University of Colorado from 96’ to 00’. His core skills sets include; drive, strong work ethic, team player, a builder mentality with high energy, motivator with the passion, purpose, and a track record to prove it.