Key Takeaways
Robotic surgical programs are among the largest capital commitments a healthcare facility makes, and the instruments that drive them are among the most vulnerable assets in the building. When a single advanced instrument costs up to $30,000 to replace, and one in five fails prematurely, the gap between "instrument management" and "instrument protection" becomes a budget-level problem.
This guide quantifies the true cost of robotic instrument damage, maps where failures happen across the workflow, and lays out the storage protocols, tracking systems, and storage investments that turn preventable losses into measurable savings.
Precision engineering, limited-use lifecycles, and high component costs combine to make every instance of robotic instrument damage a multi-layered financial event. The direct replacement cost is only the beginning. Vendor diagnostics, shipping, loaners, warranty denials, and downstream OR disruptions stack additional costs that most facilities undercount.
| Cost Driver | What It Includes | When It Applies | Typical Trigger Event | Notes for Budgeting |
| Repair labor | Technician diagnostics and component work | Instrument exhibits functional defect | Abnormal articulation detected during inspection | Many precision components (tips, wrists, cables) cannot be effectively repaired |
| Replacement instrument | Full purchase price | Damaged beyond repair or past use limit | Drop, crush, corrosion | Basic: $2,000–$3,500; advanced energy devices/bipolar forceps/staplers: $15,000–$30,000; EndoWrist: $1,500–$4,000 |
| Vendor evaluation / diagnostics | Manufacturer failure assessment and warranty determination | Any instrument removed from service | Premature failure (~20% of reusable instruments fail before designated limit) | Manufacturer reimburses only 57.9% of failures; top denial reason: mishandling |
| Shipping / logistics | Round-trip freight during evaluation | Instrument leaves facility | Cable malfunction, tip failure | Factor in downtime, backups may be needed |
| Service call / field visit | On-site technician dispatch | System-level error from instrument fault | Control housing issues (5.3% of failures) | Annual maintenance runs $100,000–$170,000; ad-hoc calls add to this |
| Loaners | Temporary replacements during repair | Inventory can't cover case volume | Multiple instruments out simultaneously | Typical hospital maintains $500,000–$2,000,000 in instrument inventory |
| Warranty exclusions | Full cost absorbed by facility on denied claims | Manufacturer determines mishandling or IFU non-compliance | Storage outside specified environmental ranges | Facilities absorb 42.1% of all failure costs, on $100K in annual failures, that's $42,100 unrecovered |
Robotic instrument failures don't just cost money on the back end; they halt live procedures. A single malfunctioning instrument can stall the entire robotic system, force mid-case swaps, and compress every downstream case on the schedule.
| Study / Source | Sample Size | Failure Rate | Key Failure Types | Key Takeaway |
| Niwa et al. (2025), Surgical Endoscopy | 757 forceps, 1,906 surgeries | 19.6% premature failure; 7.8% per-operation rate | Disk 8.2%, cable 5.7%; fenestrated bipolar forceps 45.9% | 1 in 5 instruments fails before its designated use limit |
| Tapper et al. (2019), Urology | 3,935 cases, 3.4 years | 6.2% incidence (247 failures) | Tip/wrist 46.9%, cable 30.0%, unknown 12.6%, housing 5.3%, shaft 3.2% | Tip/wrist failures dominate; mishandling is top reimbursement-denial reason |
Tip and wrist failures account for nearly half of all robotic instrument malfunctions. Cable issues follow at 30%. Hospitals that build inspection protocols and inventory buffers around these two categories will address the majority of failure risk.
| Failure Location | Typical Symptom | Likely Contributing Factor | Detection Point | Immediate Action |
| Tip / end effector | Bent, deformed tip; loss of grip precision | Stacking damage, drops, collisions | Pre-op 4× magnification inspection | Remove, quarantine, photograph, vendor ticket |
| Wrist / joint | Binding, looseness, reduced range | Crush damage from overcrowded storage ($12,000–$28,000/incident) | Pre-op functional test, intraop resistance | Stop use; do not force; swap |
| Cable / wiring | Fraying, intermittent response, error codes | 30.0% of all failures; degradation from thermal cycling, poor drying | Intraop error, post-case inspection | Discontinue, tag, segregate, report to biomed |
| Housing / connector | Cracks, poor electrical contact, corrosion | Humidity >60% causes corrosion in 30–90 days; ESD from <30% RH | Visual inspection, system error at docking | Remove; inspect connectors; check environmental logs |
| Procedure Category | Why Risk Is Higher | Common Failures | Prevention Emphasis |
| Complex pelvic (prostatectomy, hysterectomy) | Extended time, sustained force, tight spaces | Tip/wrist wear, cable fatigue | Collision-avoidance training; instrument rotation |
| Multi-quadrant abdominal | Frequent repositioning, multiple exchanges | Cable/disk failures from repeated articulation | Cycle tracking; swap instruments approaching use limits |
| Bariatric | High torque, thick tissue, extreme articulation | Fenestrated bipolar forceps failures (45.9% rate) | Enhanced inspection of bipolar forceps after every case |
Most instrument damage traces back to three controllable categories: intraoperative mechanical stress, reprocessing errors, and storage/transport mishandling. Environmental exposure rounds out the list. Each is addressable with protocol changes and targeted investment in preventive storage.
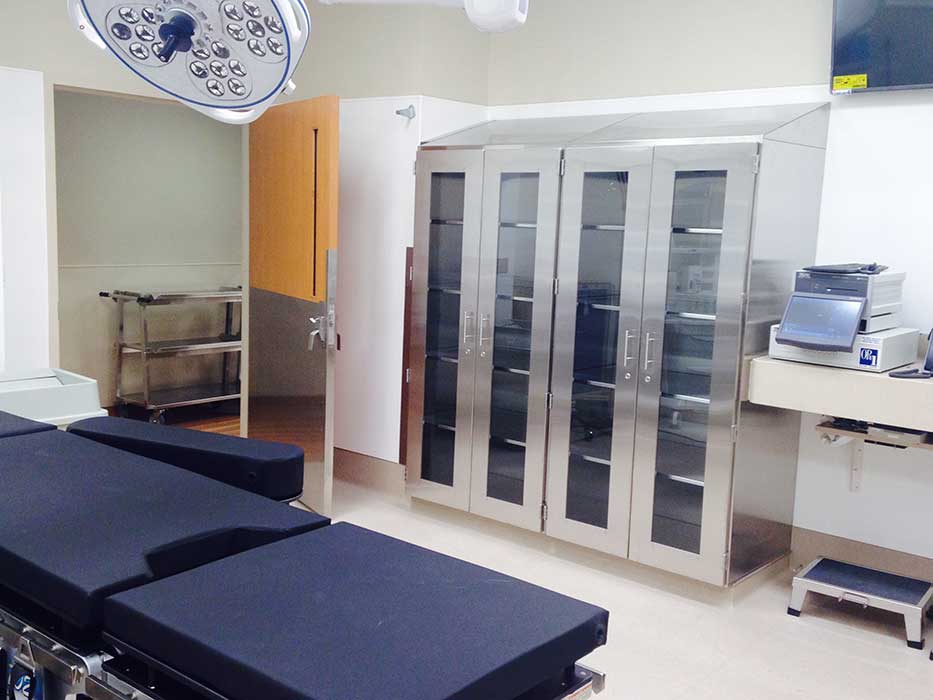
Heat/moisture exposure: Storage must maintain 18–23°C (64–73°F) and 30–60% RH per ANSI/ASHRAE/ASHE 170 and Joint Commission. ±10°F swings cause calibration drift. <30% RH creates ESD risk. Shelving must sit ≥8 inches above floor.
| Parameter | Requirement |
| Temperature | 18–23°C with ±2°F tolerance |
| Relative humidity | 30–60% with ±5% control |
| Monitoring | Continuous 24/7 with alerts for deviations sustained >15 minutes |
| Air pressure | Positive, minimum 2 outdoor and 4 total air exchanges/hour |
| Filtration | HEPA |
Proper humidity control is critical, levels above 60% cause corrosion within 30–90 days. Climate-controlled cabinets ($1,555–$32,115) or HVAC-integrated rooms ($50,000–$200,000) provide this protection. For facilities maintaining $500K–$2M in instrument inventory, the math on environmental controls is straightforward: preventing 2–3 advanced instrument losses per year pays for the cabinet.
Correct reprocessing means completing every cleaning, inspection, and packaging step the manufacturer specifies, without shortcuts. Robotic instruments contain intricate wrist joints, narrow lumens, and cable-driven articulation systems where bioburden becomes trapped. Manual cleaning involves up to 14 steps per device. Automated cleaning reduces this time by 25% (66 minutes saved per set of four instruments) with more consistent outcomes. Hidden soil and rough handling during disassembly degrade function and shorten the 10–20 use lifespan.
| Workflow Step | Best Practice | Common Deviation | Risk Created | Fix |
| Point-of-use pre-treatment | Immediate wipe-down, moisture maintenance | Instruments sit untreated during wrap-up | Dried bioburden; harder to clean | "First 60 seconds" containment checklist |
| Manual cleaning | All 14 steps with correct brushes | Steps skipped under time pressure | Hidden soil; each rework burns one use from 10–14 use lifespan | Automated systems (25% time savings) |
| Visual inspection | 4× magnification of tips, wrists, cables | Naked-eye check under poor lighting | Micro-cracks and fraying missed; intraop failure | Dedicated station with magnification and task lighting |
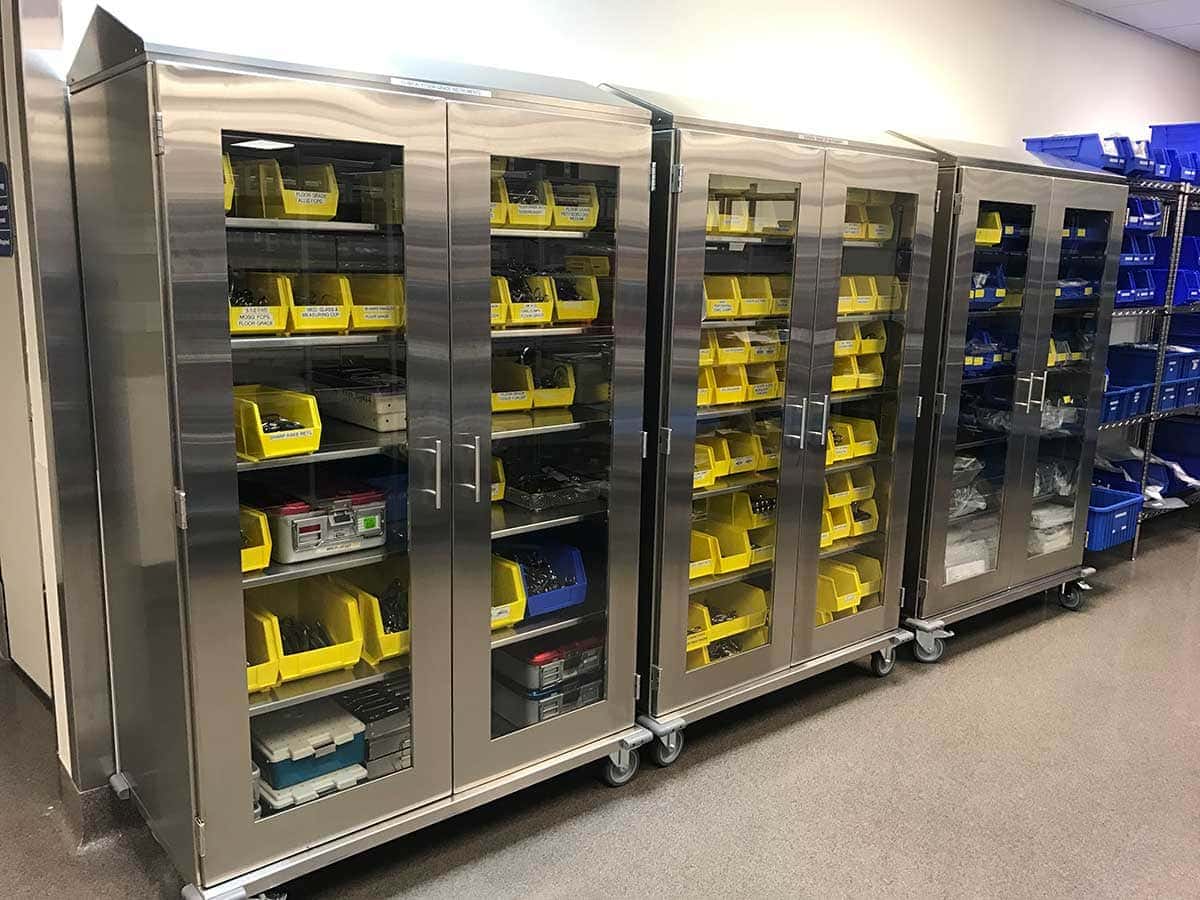
| Packaging / tray loading | Dedicated slots, tip protectors, no stacking | Generic trays, loose placement | Contact damage; calibration shift | Custom trays with shadow boards; color-coding (reduced errors from 3% to 1.5% at Virginia Mason) |
| Environmental storage | 18–23°C, 30–60% RH, continuous monitoring | Unmonitored general storage | Corrosion, ESD, calibration drift | Climate-controlled cabinets with integrated sensors |
| Cycle tracking | Barcode/RFID for ID, cycle count, history | Manual logbook or no tracking | Instruments used past life; no root-cause data | RFID reduces tray assembly time 50%; prevents up to $425,000/year in unnecessary purchases |
Instrument damage happens at handoffs. Clear ownership at each stage, OR, SPD, biomed, and leadership, eliminates the gray zones where accountability gaps cause the most expensive failures.
Prevention follows the instrument's path: setup, intraop use, post-case clearing, inspection, and storage. A protocol gap at any stage exposes instruments worth $2,000–$30,000 to avoidable damage.
Proper temperature control during storage is as critical as handling; calibration drift from ±10°F swings can render an otherwise intact instrument unusable.
Stop using it. Every minute a suspect instrument stays in play risks patient safety, compounds the damage, and weakens your warranty claim. The protocol is simple: remove, document, quarantine, route.
| Observed Issue | Risk Level | Continue? | Action | Documentation | Notify |
| Visual crack/bend | High | No | Remove, swap | Photo, incident report, case linkage | Charge nurse, SPD, biomed |
| Abnormal resistance | Medium–High | No | Stop, inspect, swap | Resistance type, cycle count | Surgeon, SPD |
| Error message | High | No | Follow system guidance, remove | Screenshot error code, instrument ID | Biomed, vendor |
| Inconsistent articulation | Medium | No | Swap, quarantine | Functional test results | SPD for inspection |
| Contamination concern | High | No | Quarantine, reprocess with flag | Soil location, reprocessing history | SPD lead, infection prevention |
Tracking systems turn instrument management from reactive to preventable. When every instrument carries a digital identity tied to its cycle count, repair history, and quarantine status, repeat failures get caught at the pattern level, not the incident level.
| Data Field | Why It Matters | Where Captured | Owner | Cadence |
| Instrument ID | Links all history to device | Enrollment | Materials mgmt | Continuous |
| Cycles / uses | Remaining life (10–20 uses) | Post-reprocessing | SPD | Per cycle; alert at 80% |
| Repair history | Reveals repeat-failure patterns | Biomed records | Biomed | Per incident |
| Damage incidents | Frequency and root-cause tracking | Incident system | Quality mgmt | Per incident |
| Quarantine status | Prevents damaged instruments re-entering service | Quarantine scan | SPD lead | Real-time |
The business case writes itself once you quantify what damage already costs. Most facilities undercount because they track replacements but miss delays, rework, inventory bloat, and denied reimbursements. A complete ROI model captures all five.
| Metric | Definition | Owner | Target | Why It Matters |
| Damage rate per 100 cases | Instruments removed for damage ÷ cases × 100 | Quality mgr | <3 (baseline: 6.2–7.8%) | Primary outcome |
| Instrument turnaround time | Hours from OR exit to ready-for-use | SPD mgr | <24 hours | Reduces excess inventory need |
| Delays from instruments | Minutes of OR delay from instrument issues | Periop director | 0 min/month | >$2,000/min makes small wins large |
| Repeat-incident rate | % of incidents with same prior root cause | Quality mgr | <5% | Validates corrective actions |
| Target Area | Baseline | 30-Day Goal | 90-Day Goal | Measurement |
| Damage incidents/month | Facility baseline | 15% reduction | 30% reduction | Incident tracking |
| Unreimbursed failure costs | ~$39.8–$50.6/surgery × volume | 10% reduction | 25% reduction | Financial + vendor reimbursement data |
| OR delays from instruments | Baseline min/month | 25% reduction | 50% reduction | OR scheduling system |
| Reprocessing rework rate | Facility baseline | <3% | <2% | SPD quality logs |
| Quarantine cycle time | Facility baseline | <72 hours | <48 hours | Tracking timestamps |
The numbers demand executive attention. A single robotic system ties up $500K–$2.5M in capital before the first case runs. Every instrument that fails early, every delay that burns OR time, and every denied warranty claim erodes the return on that investment.
Facilities pay $100,000–$170,000/year in maintenance whether the OR runs or not. Each instrument tip averages only 10–14 uses. When downtime hits, sunk costs accrue while revenue stops at >$2,000/minute.
Safety in storage is ultimately an asset-protection decision, not just a compliance checkbox.
Start with standardization. Protocol gaps, not equipment gaps, cause most preventable damage. Lock in chain-of-custody, inspection checkpoints, and quarantine routing before investing in hardware.
| Measure | Baseline | Weekly Trend | Owner | Corrective Trigger |
| Damage incidents | Facility count | Graph trend | Quality mgr | Increase over 2 consecutive weeks |
| Repeat incidents | Facility count | Track weekly | Quality mgr | Any repeat within 30 days of corrective action |
| Quarantine time | Facility hours | Weekly average | SPD lead | Average >72 hours |
| OR delays from instruments | Facility minutes | Weekly total | Periop director | Any event >15 min or weekly total increasing |
| Reprocessing rework | Facility count | Weekly count | SPD lead | >2 events in one week |
Once protocols are stable, high-density shelving upgrades can further reduce overcrowding-related damage and improve retrieval efficiency.
Comprehensive protective storage ($50,000–$150,000) pays for itself in 12–24 months. Preventing just 2–3 advanced instrument losses per year covers a climate-controlled cabinet. Avoiding delays, reducing inventory bloat, achieving higher reimbursement rates, and ensuring Joint Commission compliance compound ROI fast. Robotic surgery is growing 13.7% annually. The instrument protection gap will only widen for facilities that don't act.
Ready to protect your robotic instrument investment? Contact DSI Direct to discuss storage solutions built for your program's size and workflow.
With 21 years of sales management, marketing, P&L responsibility, business development, national account, and channel management responsibilities under his belt, Ian has established himself as a high achiever across multiple business functions. Ian was part of a small team who started a new business unit for Stanley Black & Decker in Asia from Y10’ to Y14’. He lived in Shanghai, China for two years, then continued to commercialize and scale the business throughout the Asia Pacific and Middle East regions for another two years (4 years of International experience). Ian played college football at the University of Colorado from 96’ to 00’. His core skills sets include; drive, strong work ethic, team player, a builder mentality with high energy, motivator with the passion, purpose, and a track record to prove it.